 Rimani
Condizioni di trading
Strumenti


EUR/USD continued its sluggish corrective movement on Tuesday. We cannot say that the macroeconomic background had an impact on this movement, but we did mention that the euro might go through a corrective phase for several days following its significant decline last week. The downward trend remains intact, so there should be no question about the pair's primary direction. The fundamental background also suggests that the pair should fall.
Yesterday, data showed that the euro area annual inflation rate was 2.6% in May 2024. The final estimate matched the initial report, which is why there was no market reaction. In addition, the U.S. released reports on retail sales (which slightly missed forecasts so this put pressure on the dollar) and industrial production (which exceeded expectations so it provided a bit of support to the greenback). However, overall, macro data did not significantly affect traders' sentiment or their willingness to trade on Tuesday.
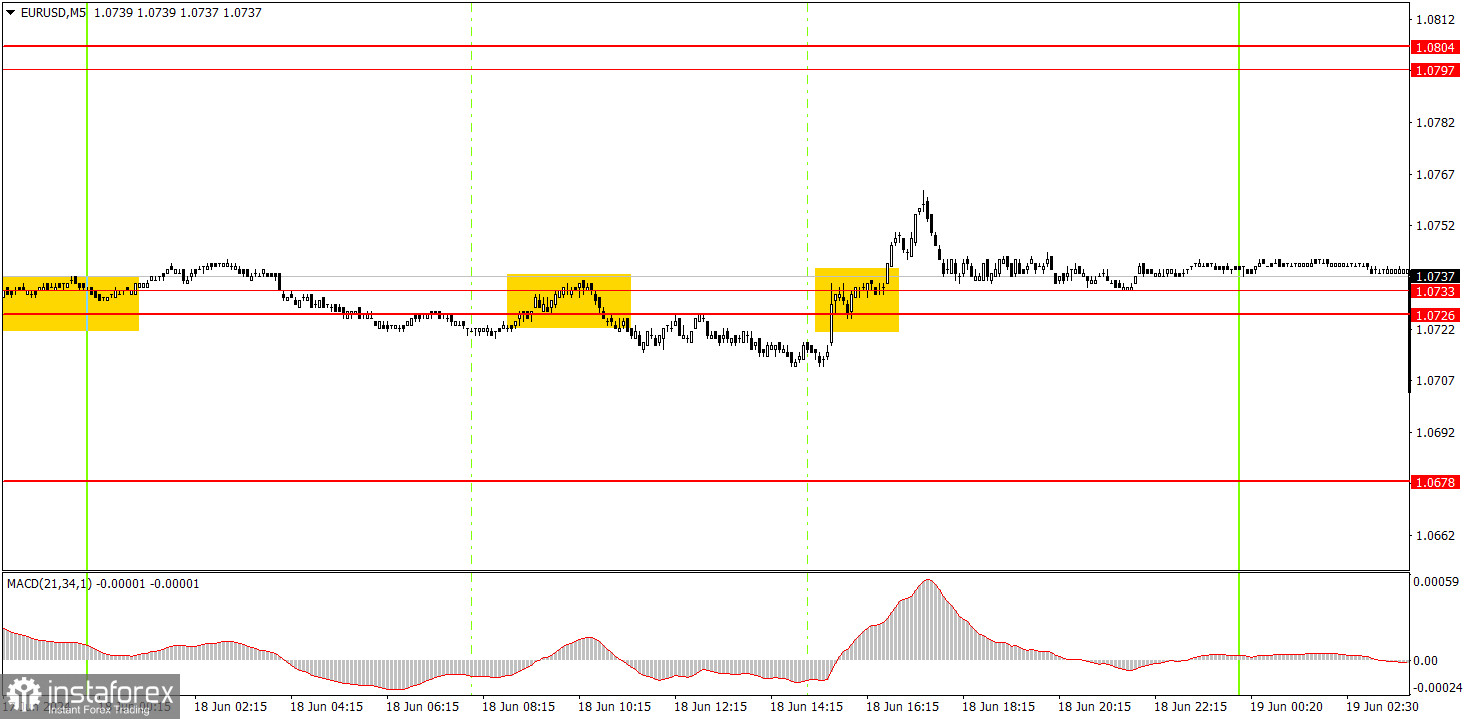
Two signals were formed on the 5-minute timeframe. The pair initially settled below the range of 1.0726-1.0733, and then climbed above it. In both cases, the pair moved in the intended direction by about 20-25 pips, with the overall volatility at around 40 pips. Therefore, it was very difficult to expect profit from any of the trading signals since the pair showed weak movements.
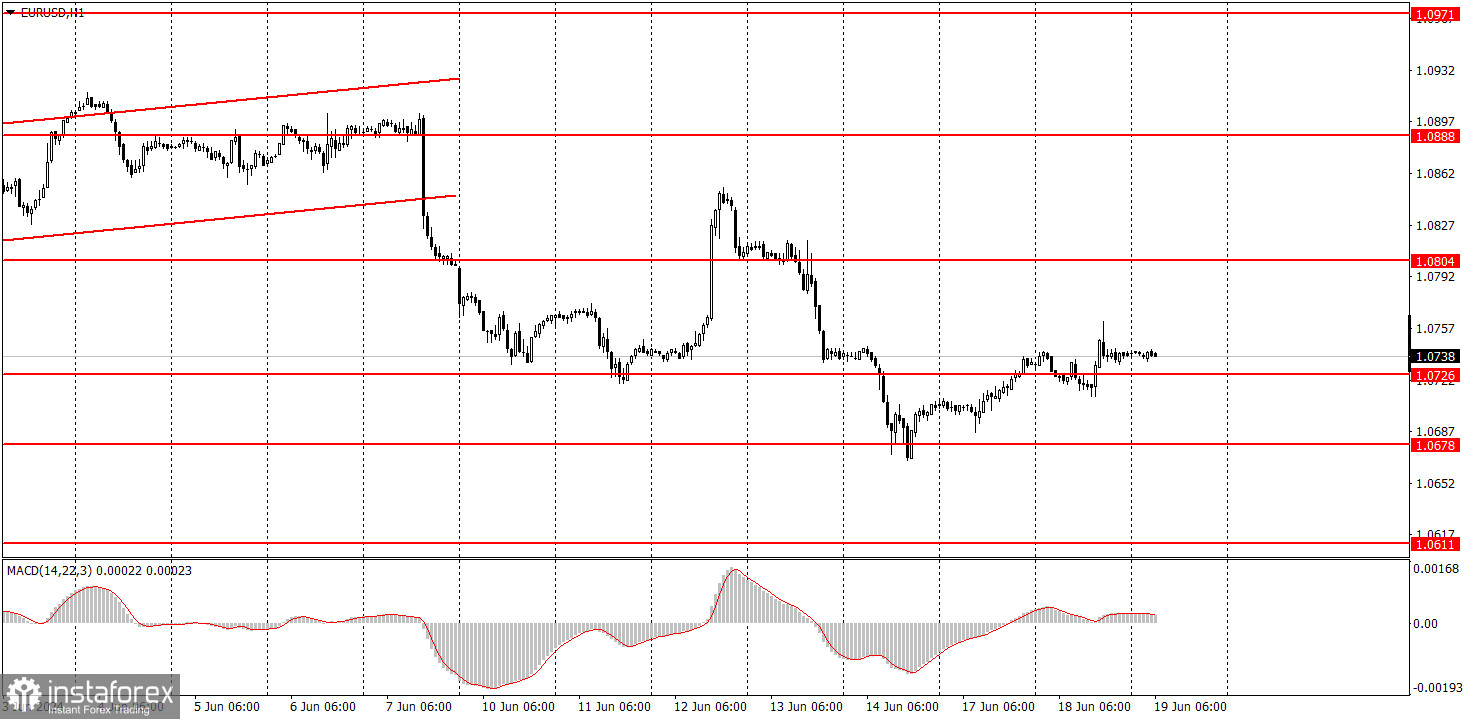
On the hourly chart, EUR/USD finally started to form a local downward trend. We still expect the pair to drop to levels of 1.0600, 1.0450, and maybe even 1.0200. However, it's important to understand that the price will not reach these targets in just a couple of weeks; they are medium-term. For instance, the pair might freely go through a corrective phase throughout this week. Nonetheless, we don't see any reasons for the euro to rise in the medium-term.
On Wednesday, traders can expect a continuation of the bullish correction since the price has breached the area of 1.0726-1.0733. However, take note that this week's volatility could be low.
The key levels on the 5M chart are 1.0483, 1.0526, 1.0568, 1.0611, 1.0678, 1.0726-1.0733, 1.0797-1.0804, 1.0838-1.0856, 1.0888-1.0896, 1.0940, 1.0971-1.0981. Today, there are no scheduled events or reports in the United States or the Eurozone. The market will likely focus on the UK inflation report.
1) Signal strength is determined by the time taken for its formation (either a bounce or level breach). A shorter formation time indicates a stronger signal.
2) If two or more trades around a certain level are initiated based on false signals, subsequent signals from that level should be disregarded.
3) In a flat market, any currency pair can produce multiple false signals or none at all. In any case, the flat trend is not the best condition for trading.
4) Trading activities are confined between the onset of the European session and mid-way through the U.S. session, after which all open trades should be manually closed.
5) On the 30-minute timeframe, trades based on MACD signals are only advisable amidst substantial volatility and an established trend, confirmed either by a trendline or trend channel.
6) If two levels lie closely together (ranging from 5 to 15 pips apart), they should be considered as a support or resistance zone.
Support and Resistance price levels can serve as targets when buying or selling. You can place Take Profit levels near them.
Red lines represent channels or trend lines, depicting the current market trend and indicating the preferable trading direction.
The MACD(14,22,3) indicator, encompassing both the histogram and signal line, acts as an auxiliary tool and can also be used as a signal source.
Significant speeches and reports (always noted in the news calendar) can profoundly influence the price dynamics. Hence, trading during their release calls for heightened caution. It may be reasonable to exit the market to prevent abrupt price reversals against the prevailing trend.
Beginners should always remember that not every trade will yield profit. Establishing a clear strategy coupled with sound money management is the cornerstone of sustained trading success.
Le recensioni analitiche di InstaForex ti renderanno pienamente consapevole delle tendenze del mercato! Essendo un cliente InstaForex, ti viene fornito un gran numero di servizi gratuiti per il trading efficiente.

