 Rimani
Condizioni di trading
Strumenti


Yesterday, EUR/USD traded with a small bullish bias amid low volatility. Volatility decreased to levels where it made no sense to trade intraday. If there are no movements, how can anyone manage to make some profit? Not only were there no movements, but there were no news reports as well. The Eurozone and U.S. economic calendars were relatively quiet. Thus, the market had nothing to react to and it found no reason to open positions.
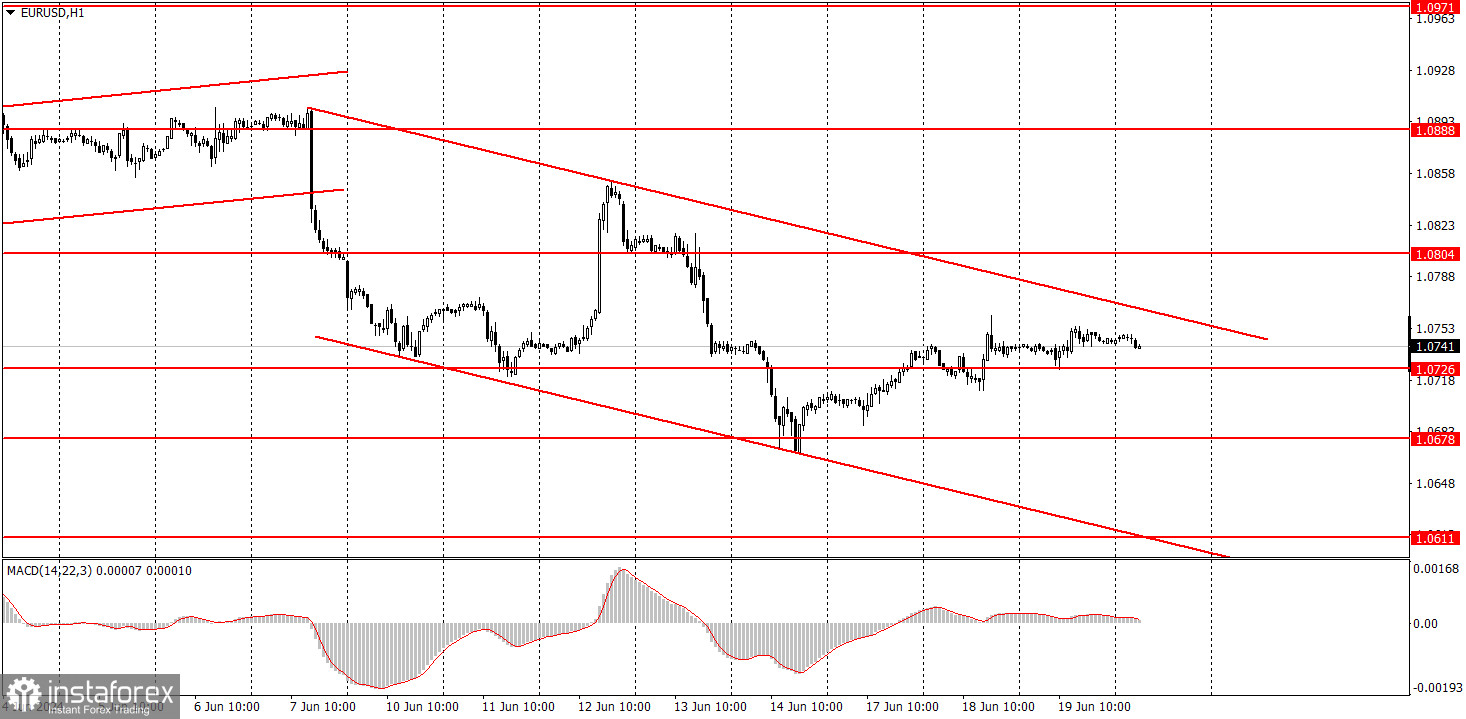
A descending channel has formed, but this doesn't make everything better. The price will likely remain within its boundaries for some time since the pair is headed downwards on practically all the timeframes. It is currently more appealing for the euro to fall than rise in any case. Therefore, traders should focus on short positions and sell signals. At the same time, the pair could calmly correct for another week or two, as EUR/USD has never been an instrument known for strong movements.
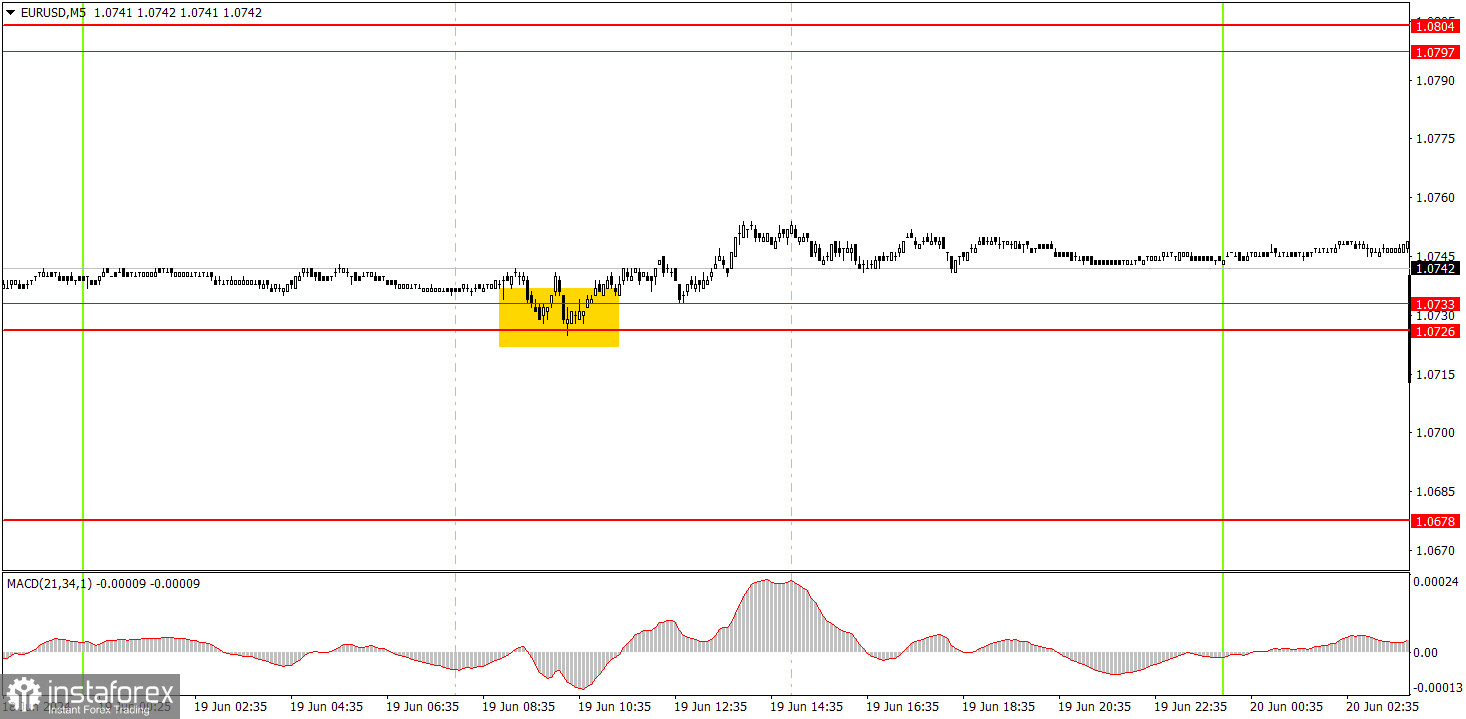
Only one trading signal was formed on the 5-minute timeframe. As seen in the chart above, the price accurately bounced from the range of 1.0726-1.0733, after which it managed to climb 15 pips. This is the only amount of profit that beginners could earn for the day, as the pair failed to show further movement. It's also noteworthy that even though the buy signal was ideal, it resulted in very small profit. The issue lies not in the signals themselves but in the absence of movements in the market.
On the hourly chart, EUR/USD finally started to form a local downward trend. We still expect the pair to drop to levels of 1.0600, 1.0450, and maybe even 1.0200. However, it's important to understand that the price will not reach these targets in just a couple of weeks; they are medium-term. For instance, the pair might freely go through a corrective phase for another week. Nonetheless, we don't see any reasons for the euro to rise in the medium-term.
On Thursday, traders can expect a continuation of the bullish correction since the price has breached the area of 1.0726-1.0733. However, take note that this week's volatility could be low.
The key levels on the 5M chart are 1.0483, 1.0526, 1.0568, 1.0611, 1.0678, 1.0726-1.0733, 1.0797-1.0804, 1.0838-1.0856, 1.0888-1.0896, 1.0940, 1.0971-1.0981. Today, there is nothing to highlight in the Eurozone's economic calendar. The U.S. docket will feature secondary reports on building permits and initial jobless claims. We don't expect these reports to cause a strong market reaction.
1) Signal strength is determined by the time taken for its formation (either a bounce or level breach). A shorter formation time indicates a stronger signal.
2) If two or more trades around a certain level are initiated based on false signals, subsequent signals from that level should be disregarded.
3) In a flat market, any currency pair can produce multiple false signals or none at all. In any case, the flat trend is not the best condition for trading.
4) Trading activities are confined between the onset of the European session and mid-way through the U.S. session, after which all open trades should be manually closed.
5) On the 30-minute timeframe, trades based on MACD signals are only advisable amidst substantial volatility and an established trend, confirmed either by a trendline or trend channel.
6) If two levels lie closely together (ranging from 5 to 15 pips apart), they should be considered as a support or resistance zone.
Support and Resistance price levels can serve as targets when buying or selling. You can place Take Profit levels near them.
Red lines represent channels or trend lines, depicting the current market trend and indicating the preferable trading direction.
The MACD(14,22,3) indicator, encompassing both the histogram and signal line, acts as an auxiliary tool and can also be used as a signal source.
Significant speeches and reports (always noted in the news calendar) can profoundly influence the price dynamics. Hence, trading during their release calls for heightened caution. It may be reasonable to exit the market to prevent abrupt price reversals against the prevailing trend.
Beginners should always remember that not every trade will yield profit. Establishing a clear strategy coupled with sound money management is the cornerstone of sustained trading success.
Le recensioni analitiche di InstaForex ti renderanno pienamente consapevole delle tendenze del mercato! Essendo un cliente InstaForex, ti viene fornito un gran numero di servizi gratuiti per il trading efficiente.

