 Rimani
Condizioni di trading
Strumenti


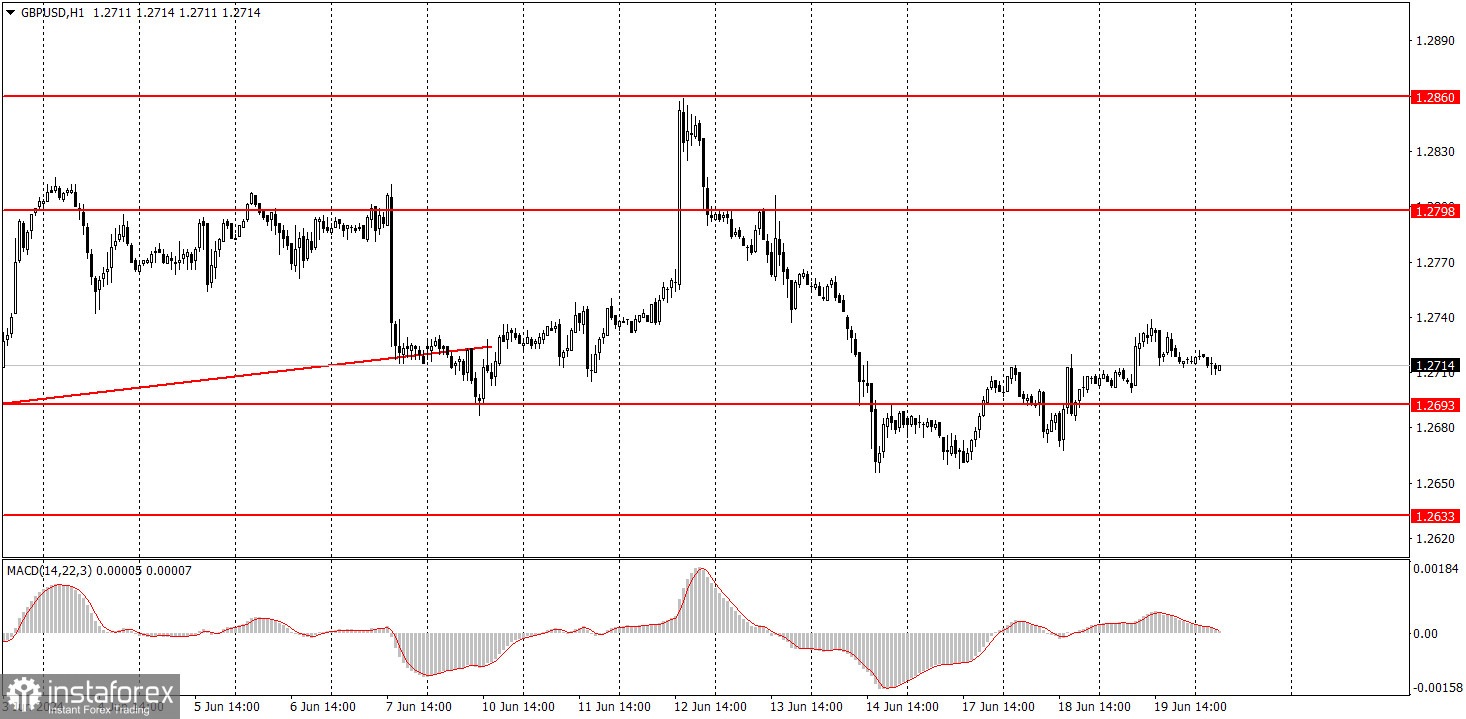
GBP/USD continued to correct higher on Wednesday. You might wonder what's surprising about that? There have been several surprising moments, but over the past six months, what used to be surprising has now become the norm. Yesterday, the UK CPI report showed that inflation slowed to 2% in May. For those who don't remember, the Bank of England is aiming for 2%. This means that the British central bank can now begin to ease its monetary policy, with the next meeting scheduled for today. However, according to forecasts, the Bank is expected to hold interest rates again. But even if we ignore the BoE meeting, the fact that inflation has slowed to 2% should have exerted pressure on the pound, as it's clear that policy easing will commence in the UK in the near future, unlike in the U.S...
Nevertheless, the British pound continues to ignore all data that implies its decline. Yesterday, the currency even managed to appreciate on the inflation report. Therefore, logical and predictable movements are still nowhere in sight.
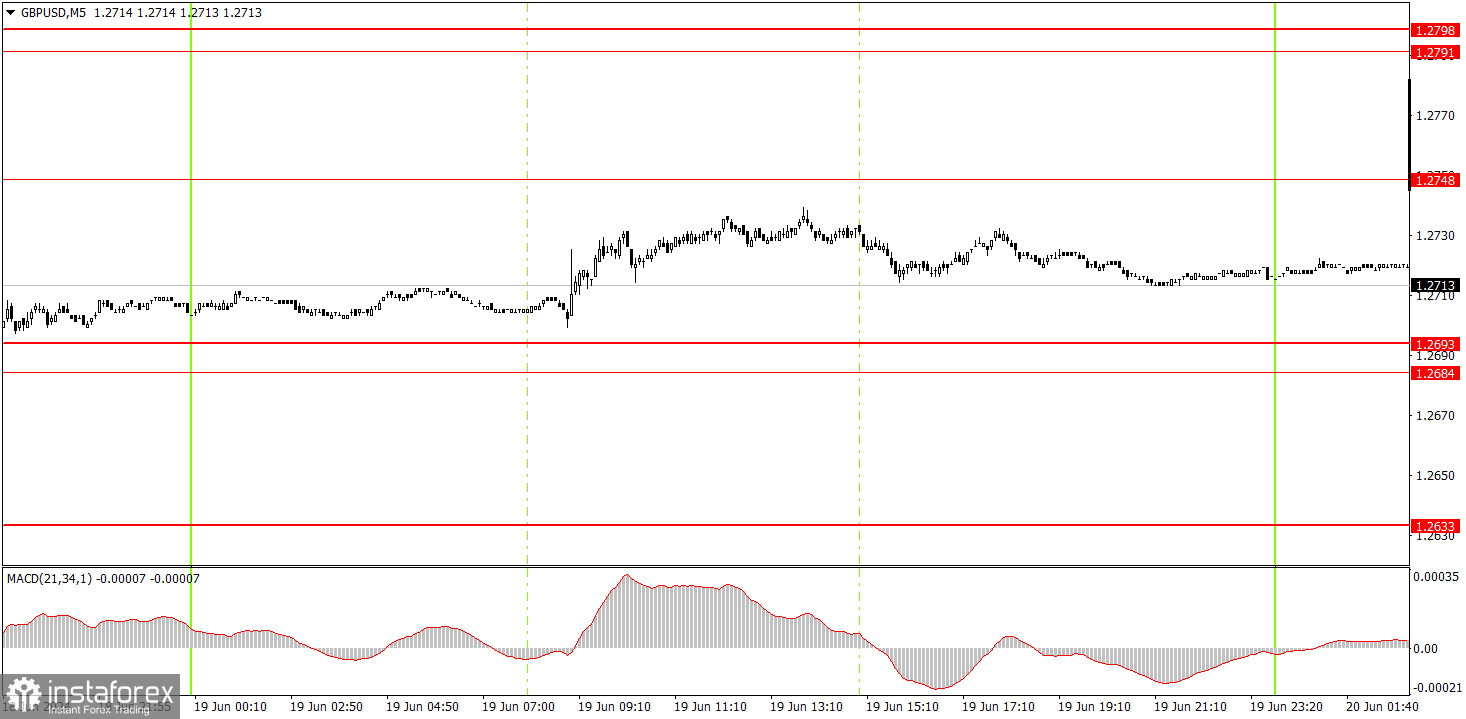
No trading signals were formed on the 5-minute timeframe. Besides the pair's illogical movements, the market also faced very low volatility, which was another "surprising moment" of the day. The market's reaction to the inflation report was not only illogical, but also relatively muted. Traders could only open long positions on Tuesday when the price surpassed the range of 1.2684-1.2693.
On the hourly chart, the GBP/USD pair maintains good prospects for forming a downward trend, although the uptrend still persists along with a monthly flat pattern. It was a good thing that the price managed to break below the level of 1.2693 on Friday. However, this week started with the pound climbing above this level once again. In general, the market refuses to sell the pound, even if there are technical, fundamental, and macroeconomic reasons to do so.
On Thursday, we would advise you to closely monitor the area of 1.2684-1.2693. Long positions are valid for now, but if the price settles below this area once again, it might be worth trying to sell the British pound.
The key levels on the 5M chart are 1.2457, 1.2502, 1.2541-1.2547, 1.2605-1.2633, 1.2684-1.2693, 1.2748, 1.2791-1.2798, 1.2848-1.2860, 1.2913, 1.2980. Today, the key event of the day will be the BoE meeting. However, we advise you not to expect a logical market reaction. We believe that the pound will only fall in the event of an unexpected (for the market) interest rate cut.
1) Signal strength is determined by the time taken for its formation (either a bounce or level breach). A shorter formation time indicates a stronger signal.
2) If two or more trades around a certain level are initiated based on false signals, subsequent signals from that level should be disregarded.
3) In a flat market, any currency pair can produce multiple false signals or none at all. In any case, the flat trend is not the best condition for trading.
4) Trading activities are confined between the onset of the European session and mid-way through the U.S. session, after which all open trades should be manually closed.
5) On the 30-minute timeframe, trades based on MACD signals are only advisable amidst substantial volatility and an established trend, confirmed either by a trendline or trend channel.
6) If two levels lie closely together (ranging from 5 to 15 pips apart), they should be considered as a support or resistance zone.
Support and Resistance price levels can serve as targets when buying or selling. You can place Take Profit levels near them.
Red lines represent channels or trend lines, depicting the current market trend and indicating the preferable trading direction.
The MACD(14,22,3) indicator, encompassing both the histogram and signal line, acts as an auxiliary tool and can also be used as a signal source.
Significant speeches and reports (always noted in the news calendar) can profoundly influence the price dynamics. Hence, trading during their release calls for heightened caution. It may be reasonable to exit the market to prevent abrupt price reversals against the prevailing trend.
Beginners should always remember that not every trade will yield profit. Establishing a clear strategy coupled with sound money management is the cornerstone of sustained trading success.
Le recensioni analitiche di InstaForex ti renderanno pienamente consapevole delle tendenze del mercato! Essendo un cliente InstaForex, ti viene fornito un gran numero di servizi gratuiti per il trading efficiente.


