 Rimani
Condizioni di trading
Strumenti


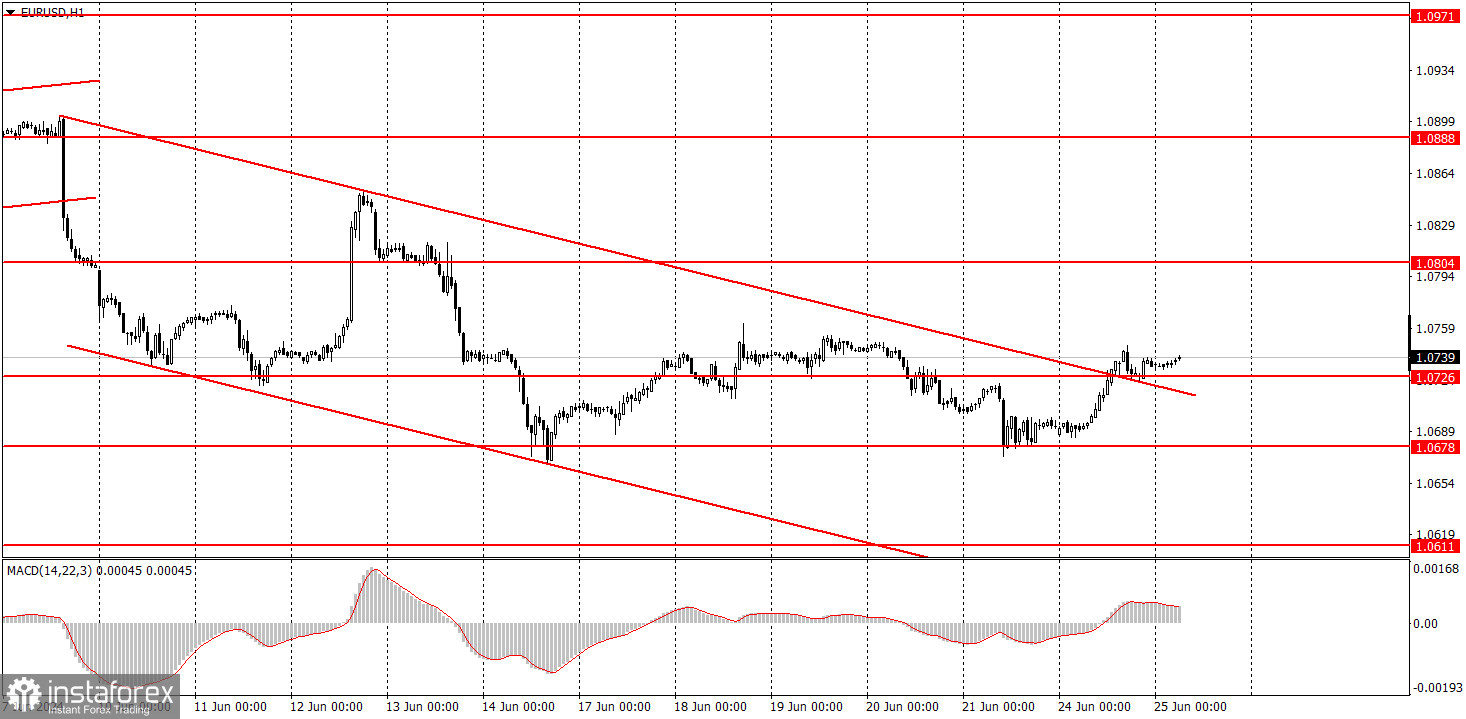
EUR/USD started a new corrective phase and consolidated above the descending channel. In reality, this does not guarantee a shift to an upward trend. It means that the correction, which started from the level of 1.0678, may be prolonged. Therefore, beginners can expect the price to move to the level of 1.0804 this week. The downward trend remains intact.
There were no significant reports or events in either the Eurozone or the US. We can only mention the IFO business climate index released in Germany, which turned out to be lower than forecasted, but the euro still traded with positivity during the European trading session. Therefore, we can conclude that the market completely ignored this report, as we had anticipated. There are hardly any important events and reports throughout the current week. The euro can continue to correct higher, and volatility will likely remain low.
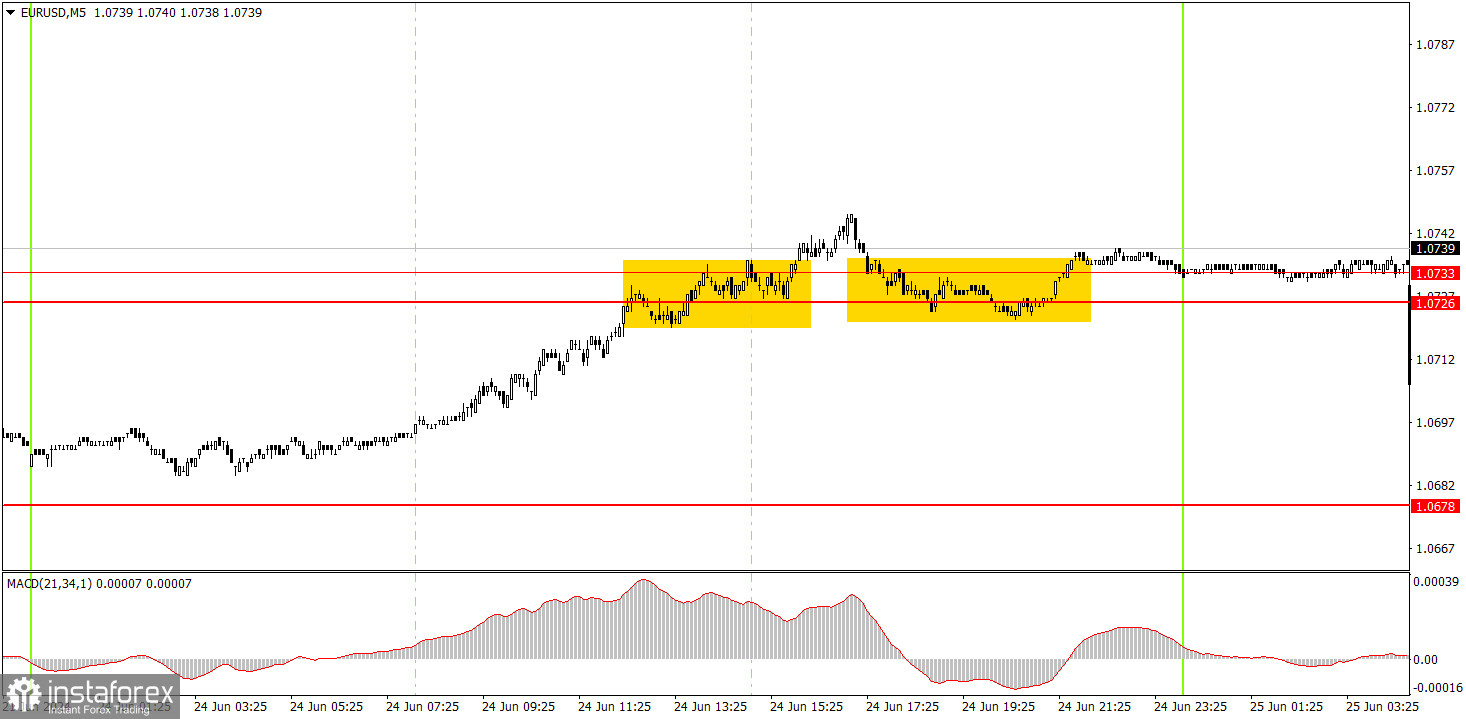
Two trading signals were formed on the 5-minute timeframe. To give you a heads-up, the price bounced off the 1.0678 level four times on Friday. Since the pair's volatility is currently quite low, it's possible to consider carrying over trades between days and even weeks. The problem is that the price can't even manage to reach the nearest targets within 10-12 hours. If beginners opened long positions on Friday, they could have made a profit today around the area of 1.0726-1.0733. Moreover, the price overcame this area, so long positions remain valid with a target of 1.0797.
On the hourly chart, EUR/USD finally started to form a local downward trend. We still expect the pair to drop to levels of 1.0600, 1.0450, and even 1.0200. However, it's important to understand that the price will not reach these targets immediately; they are medium-term objectives. For instance, the pair could go through a corrective phase for another week, as the pair has not breached the level of 1.0678 even after several attempts. We don't see any reasons for the euro to rise in the medium-term.
On Tuesday, traders can expect a new upward move since the price breached the 1.0726-1.0733 area. However, it's important to remember that the pair may go through significantly low volatility again, which also means that the pair might show erratic movements.
The key levels on the 5M chart are 1.0483, 1.0526, 1.0568, 1.0611, 1.0678, 1.0726-1.0733, 1.0797-1.0804, 1.0838-1.0856, 1.0888-1.0896, 1.0940, 1.0971-1.0981. Today, the euro area economic calendar is empty. There is absolutely nothing noteworthy throughout the day.
1) Signal strength is determined by the time taken for its formation (either a bounce or level breach). A shorter formation time indicates a stronger signal.
2) If two or more trades around a certain level are initiated based on false signals, subsequent signals from that level should be disregarded.
3) In a flat market, any currency pair can produce multiple false signals or none at all. In any case, the flat trend is not the best condition for trading.
4) Trading activities are confined between the onset of the European session and mid-way through the U.S. session, after which all open trades should be manually closed.
5) On the 30-minute timeframe, trades based on MACD signals are only advisable amidst substantial volatility and an established trend, confirmed either by a trendline or trend channel.
6) If two levels lie closely together (ranging from 5 to 15 pips apart), they should be considered as a support or resistance zone.
Support and Resistance price levels can serve as targets when buying or selling. You can place Take Profit levels near them.
Red lines represent channels or trend lines, depicting the current market trend and indicating the preferable trading direction.
The MACD(14,22,3) indicator, encompassing both the histogram and signal line, acts as an auxiliary tool and can also be used as a signal source.
Significant speeches and reports (always noted in the news calendar) can profoundly influence the price dynamics. Hence, trading during their release calls for heightened caution. It may be reasonable to exit the market to prevent abrupt price reversals against the prevailing trend.
Beginners should always remember that not every trade will yield profit. Establishing a clear strategy coupled with sound money management is the cornerstone of sustained trading success.
Le recensioni analitiche di InstaForex ti renderanno pienamente consapevole delle tendenze del mercato! Essendo un cliente InstaForex, ti viene fornito un gran numero di servizi gratuiti per il trading efficiente.


