 Rimani
Condizioni di trading
Strumenti


Yesterday, EUR/USD tried to climb higher again and even broke the previous day's high by a few pips. The pair opened Monday with a bearish gap, and it was precisely because of this gap that the euro could not show a more convincing rise. Although there were no economic reports or fundamental events on Monday, the results of the second round of elections in France were announced over the weekend. Keep in mind that last Monday, the market welcomed the defeat of Marine Le Pen's party. The National Rally is said to have lost the second round, as it came in third place, which is likely why the euro rose on Monday.
However, as seen in the chart above, the movement is slowing down. Last week, there were many factors for the dollar's decline, but this week there hasn't been any yet. The situation could change today when Federal Reserve Chief Jerome Powell gives a speech in Congress. Or tomorrow, when Powell speaks in Congress for the second time. Or on Thursday, when the Consumer Price Index is published in the U.S..
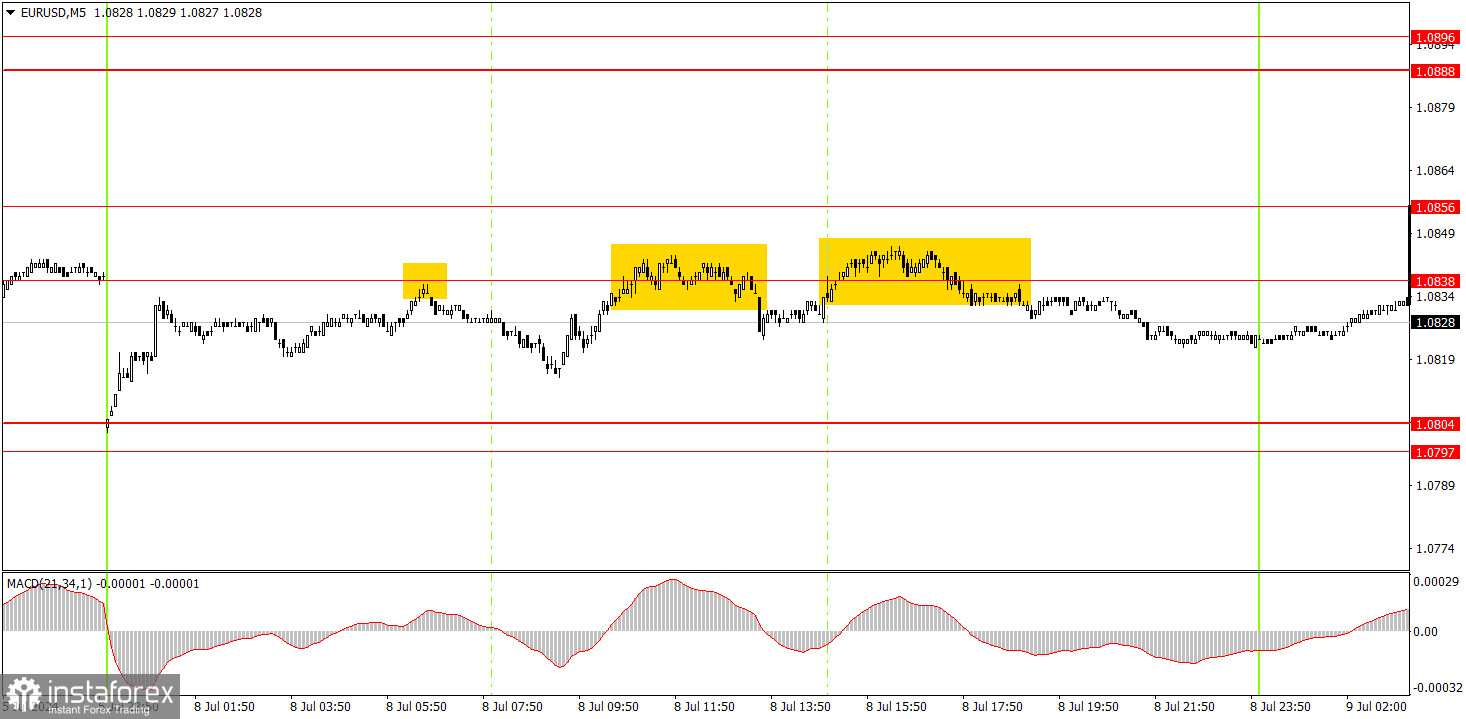
On the 5-minute time frame, three sell signals were formed around the 1.0838 level. Since this level should be considered alongside the 1.0856 level, there were three bounces from the area. The price could not even fall by 15 pips each time, and the signals just duplicated each other. Volatility was very low, so it was difficult to expect good movements and good profits.
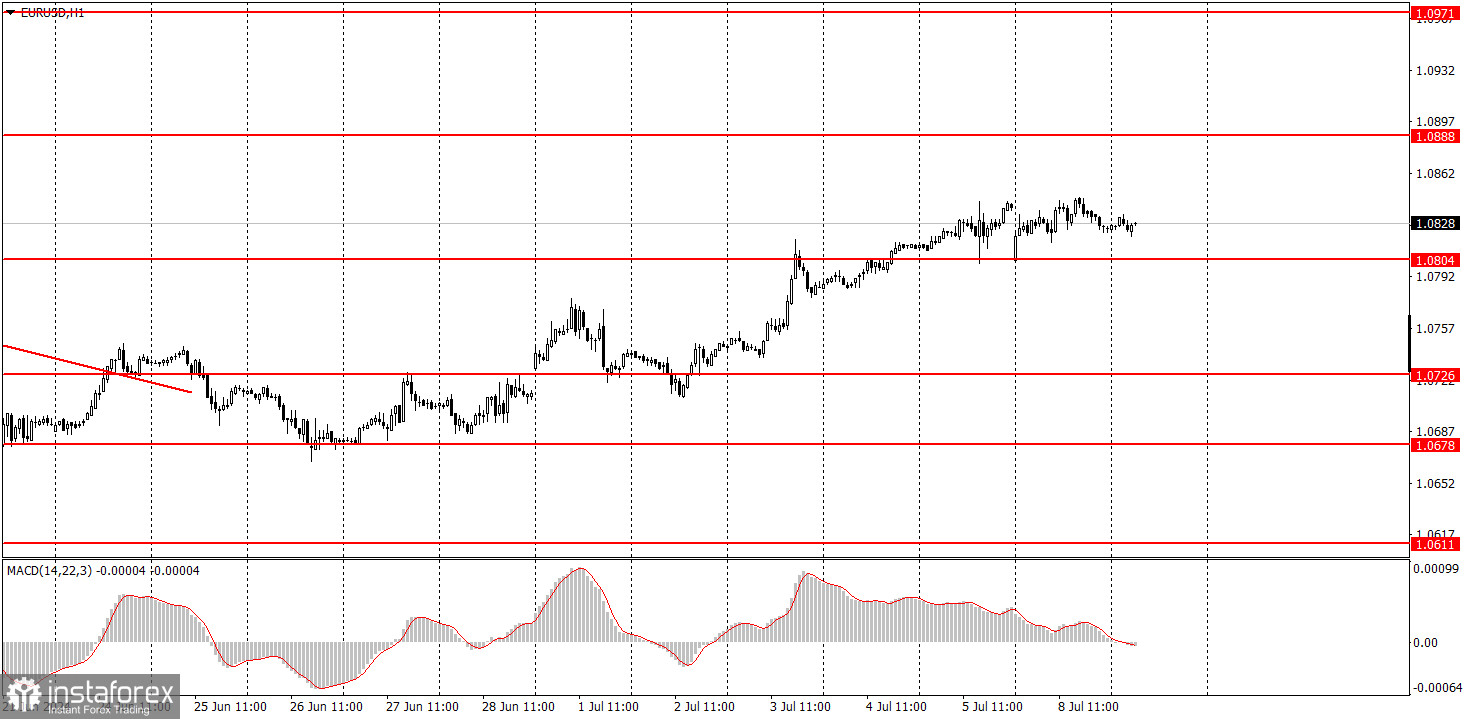
On the hourly chart, EUR/USD is unable to break through the 1.0678 level, and last week's economic reports had a devastating effect on the dollar. Therefore, it was logical for the euro to rise. Despite this movement, the overall (downward) trend has not changed, but the euro has been frequently trading with strong corrections over the past 7-8 months. Formally, the euro is in a downward trend, as seen on the higher time frames, but the process of the pair's decline in the medium-term has been extremely slow.
On Tuesday, beginners can trade from the 1.0838-1.0856 area. However, please note that the pair may experience very low volatility. Only Powell's speech could potentially move the pair off the dead center.
The key levels on the 5M chart are 1.0483, 1.0526, 1.0568, 1.0611, 1.0678, 1.0726-1.0733, 1.0797-1.0804, 1.0838-1.0856, 1.0888-1.0896, 1.0940, 1.0971-1.0981. Today, there are no important events scheduled in either the Eurozone or the US, except for Powell's speech.
1) Signal strength is determined by the time taken for its formation (either a bounce or level breach). A shorter formation time indicates a stronger signal.
2) If two or more trades around a certain level are initiated based on false signals, subsequent signals from that level should be disregarded.
3) In a flat market, any currency pair can produce multiple false signals or none at all. In any case, the flat trend is not the best condition for trading.
4) Trading activities are confined between the onset of the European session and mid-way through the U.S. session, after which all open trades should be manually closed.
5) On the 30-minute timeframe, trades based on MACD signals are only advisable amidst substantial volatility and an established trend, confirmed either by a trendline or trend channel.
6) If two levels lie closely together (ranging from 5 to 15 pips apart), they should be considered as a support or resistance zone.
Support and Resistance price levels can serve as targets when buying or selling. You can place Take Profit levels near them.
Red lines represent channels or trend lines, depicting the current market trend and indicating the preferable trading direction.
The MACD(14,22,3) indicator, encompassing both the histogram and signal line, acts as an auxiliary tool and can also be used as a signal source.
Significant speeches and reports (always noted in the news calendar) can profoundly influence the price dynamics. Hence, trading during their release calls for heightened caution. It may be reasonable to exit the market to prevent abrupt price reversals against the prevailing trend.
Beginners should always remember that not every trade will yield profit. Establishing a clear strategy coupled with sound money management is the cornerstone of sustained trading success.
Le recensioni analitiche di InstaForex ti renderanno pienamente consapevole delle tendenze del mercato! Essendo un cliente InstaForex, ti viene fornito un gran numero di servizi gratuiti per il trading efficiente.


