 Rimani
Condizioni di trading
Strumenti


Yesterday, GBP/USD was trading higher throughout most of the day. It is difficult to explain why the pound rose on Monday, given that there were no economic reports or fundamental events related to the dollar or the pound. One could try to link the results of the French elections to the pound's rise through the euro's exchange rate, but that seems unconvincing, to say the least. Therefore, it is most likely that the British currency rose purely out of momentum.
We have already mentioned that if the market is ready to buy the pound under any circumstances and even without any reasons, stopping the pair's growth will be nearly impossible. Last week, there were significant reasons for the British currency to rise. However, we have already started a new week, and yet the pound still managed to show positive trades. Furthermore, the market continues to ignore the fact that the Bank of England might start easing monetary policy at the next meeting, something the Federal Reserve can only dream of at the moment.
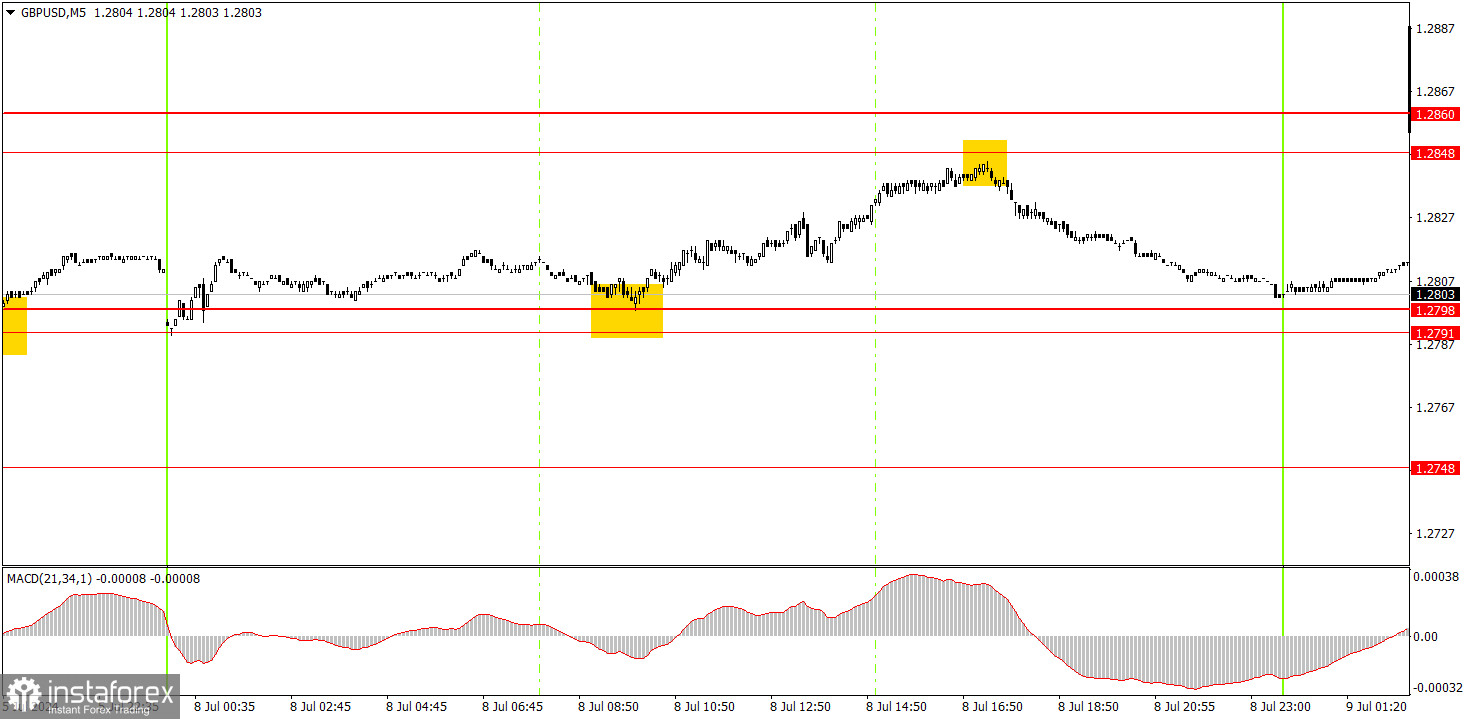
On the 5-minute timeframe, two nearly perfect signals were formed. First, the price bounced off the 1.2798 level and almost reached the 1.2848 level (with an error margin of only 3 pips). The slight bounce from the 1.2848 level could have been used to open short positions. By the end of the day, the price managed to return to the 1.2798 level. Therefore, these two trades could have yielded about 40 pips of profit. This modest gain is due to the fact that there was practically no volatility again.
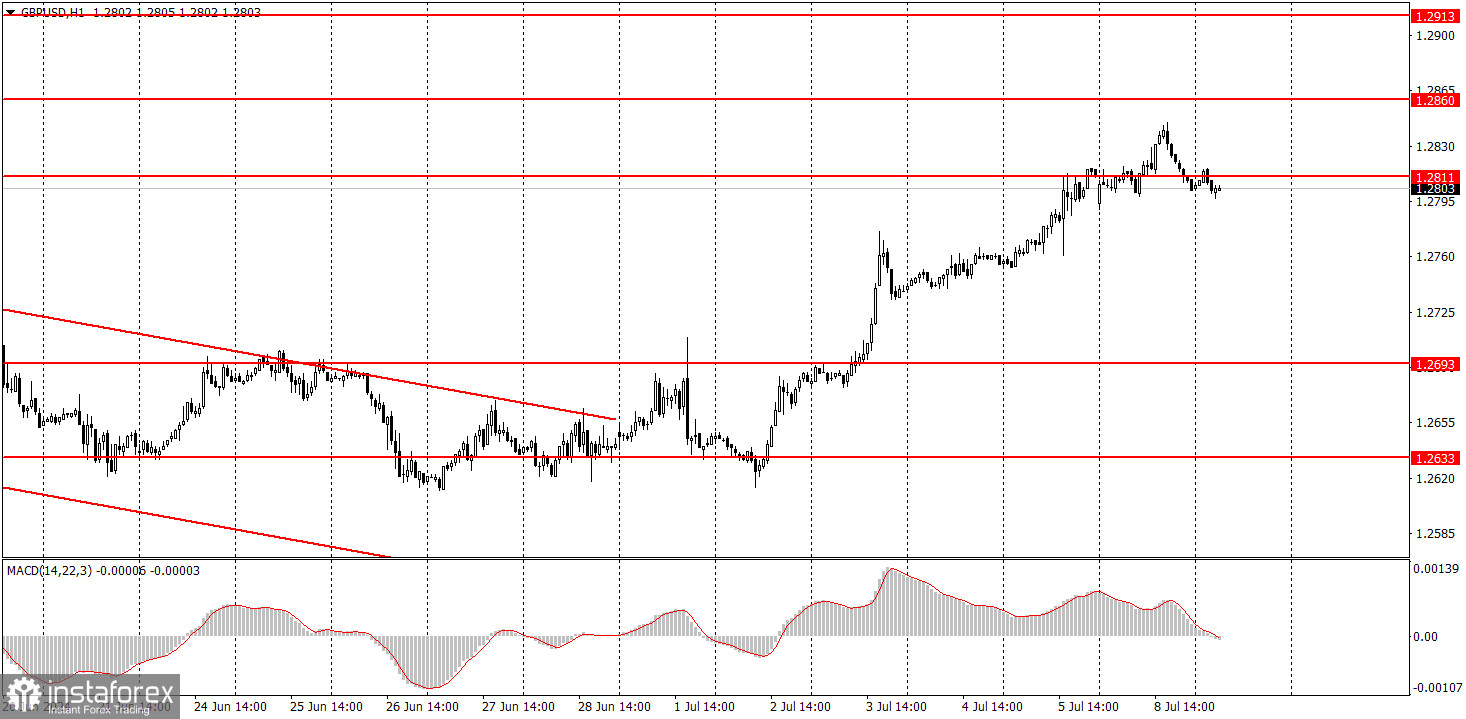
On the hourly chart, GBP/USD continues to show promising signs of forming a downtrend, but this doesn't mean that the pair can't form an upward trend. The pair has been rising again, and overall, it continues to exhibit erratic and illogical movements. Currently, the pound sterling has returned to its recent local high and continues to ignore the fundamental background.
On Tuesday, the pound sterling may take a break after going through quite a positive week. We can expect a new round of the bearish correction, which can be identified once the price settles below the 1.2791-1.2798 area.
The key levels on the 5M chart are 1.2457, 1.2502, 1.2541-1.2547, 1.2605-1.2633, 1.2684-1.2693, 1.2748, 1.2791-1.2798, 1.2848-1.2860, 1.2913, and 1.2980. Today, there are no significant events scheduled in the UK, but Fed Chief Jerome Powell's first speech in Congress will take place in the US. Therefore, market participants may receive some important information.
1) Signal strength is determined by the time taken for its formation (either a bounce or level breach). A shorter formation time indicates a stronger signal.
2) If two or more trades around a certain level are initiated based on false signals, subsequent signals from that level should be disregarded.
3) In a flat market, any currency pair can produce multiple false signals or none at all. In any case, the flat trend is not the best condition for trading.
4) Trading activities are confined between the onset of the European session and mid-way through the U.S. session, after which all open trades should be manually closed.
5) On the 30-minute timeframe, trades based on MACD signals are only advisable amidst substantial volatility and an established trend, confirmed either by a trendline or trend channel.
6) If two levels lie closely together (ranging from 5 to 15 pips apart), they should be considered as a support or resistance zone.
Support and Resistance price levels can serve as targets when buying or selling. You can place Take Profit levels near them.
Red lines represent channels or trend lines, depicting the current market trend and indicating the preferable trading direction.
The MACD(14,22,3) indicator, encompassing both the histogram and signal line, acts as an auxiliary tool and can also be used as a signal source.
Significant speeches and reports (always noted in the news calendar) can profoundly influence the price dynamics. Hence, trading during their release calls for heightened caution. It may be reasonable to exit the market to prevent abrupt price reversals against the prevailing trend.
Beginners should always remember that not every trade will yield profit. Establishing a clear strategy coupled with sound money management is the cornerstone of sustained trading success.
Le recensioni analitiche di InstaForex ti renderanno pienamente consapevole delle tendenze del mercato! Essendo un cliente InstaForex, ti viene fornito un gran numero di servizi gratuiti per il trading efficiente.

