 Rimani
Condizioni di trading
Strumenti


EUR/USD traded positively on Friday. The euro started to surge in the morning and it had no relation to the economic reports published later. The U.S. released the first notable reports in the second half of the day. As we can see, the market is still willing to buy the single currency for no reason. To be more precise, the market is ready to sell the dollar at any time.
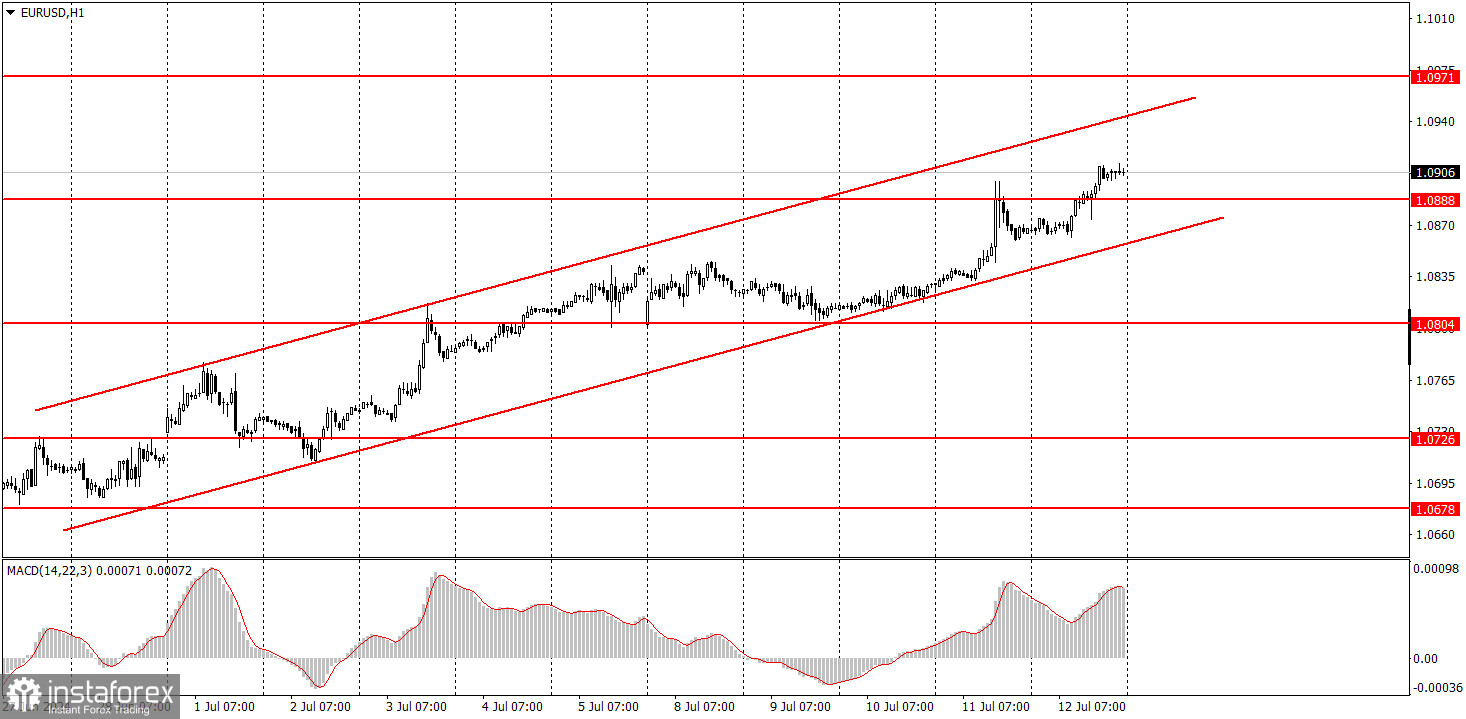
To be fair, it is vital to mention that in the past two weeks, the macroeconomic background has not supported the dollar at all. However, this does not change the fact that the market itself is eager to sell the dollar and continues to ignore other fundamental factors that should also influence the pair's movement. From a technical standpoint, there are no questions about the pair's growth. An ascending channel has formed, within which the pair is holding. Therefore, we shouldn't expect the euro to fall until the price consolidates below this channel.
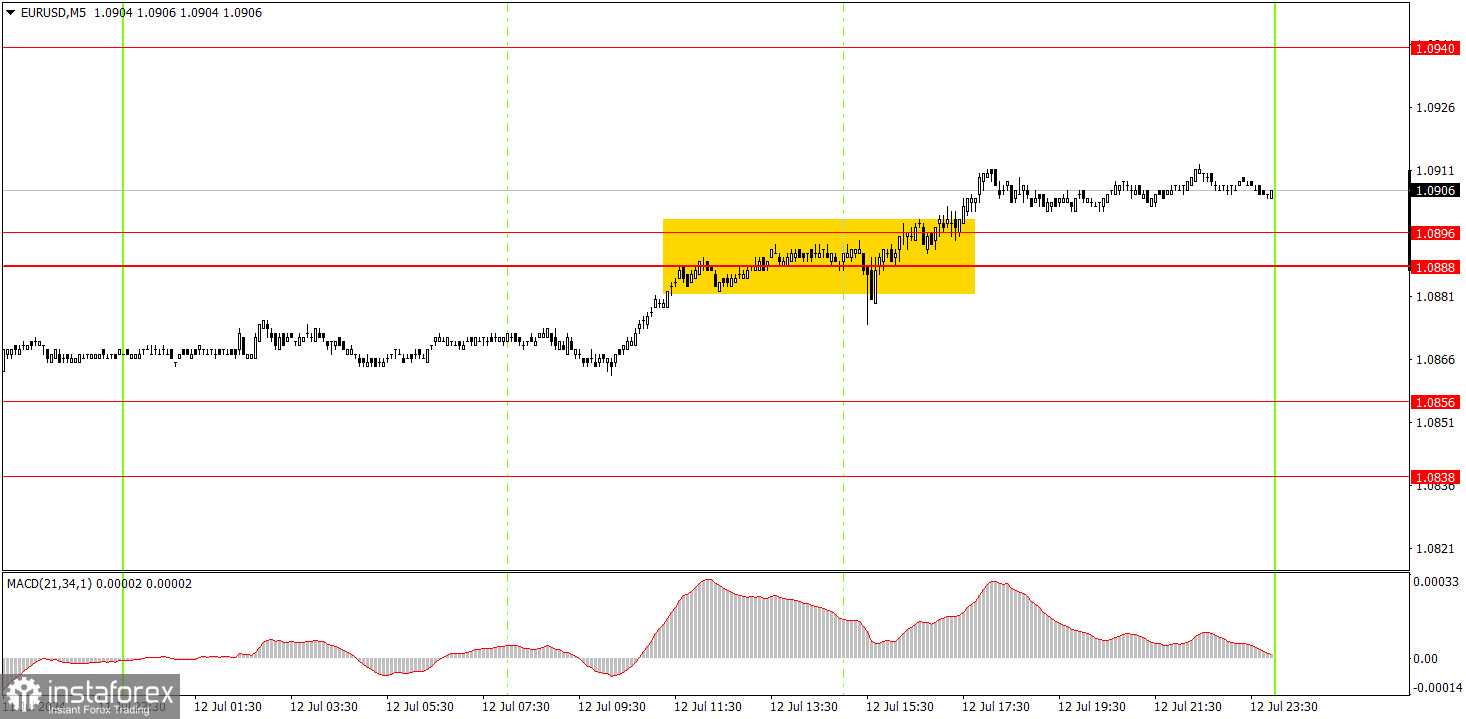
On the 5-minute timeframe, there was only one buy signal, which was hardly precise. The price consolidated above the 1.0888-1.0896 area, but the point was that the market was willing to buy the pair even without this signal. Nevertheless, novice traders could have opened long positions, especially since the U.S. Producer Price Index did not support the dollar (although it should have), and the Consumer Sentiment Index happily provoked a new decline.
On the hourly chart, EUR/USD is unable to break through the 1.0678 level, and the recent economic reports had a devastating effect on the dollar. Therefore, it was logical for the euro to rise. Despite this movement, the overall (downward) trend has not changed, but the euro has been frequently trading with strong bullish corrections over the past 7-8 months. Formally, the euro is in a downward trend, as seen on the higher time frames, but the process of the pair's decline in the medium-term has been extremely slow.
On Monday, novice traders can stay in long positions based on the signal of overcoming the 1.0888-1.0896 area. Overall, until the price consolidates below the channel, it would be wise to consider buying on pullbacks.
The key levels on the 5M chart are 1.0483, 1.0526, 1.0568, 1.0611, 1.0678, 1.0726-1.0733, 1.0797-1.0804, 1.0838-1.0856, 1.0888-1.0896, 1.0940, 1.0971-1.0981. On Monday, the Eurozone industrial production report will be published, and Federal Reserve Chair Jerome Powell will speak.
1) Signal strength is determined by the time taken for its formation (either a bounce or level breach). A shorter formation time indicates a stronger signal.
2) If two or more trades around a certain level are initiated based on false signals, subsequent signals from that level should be disregarded.
3) In a flat market, any currency pair can produce multiple false signals or none at all. In any case, the flat trend is not the best condition for trading.
4) Trading activities are confined between the onset of the European session and mid-way through the U.S. session, after which all open trades should be manually closed.
5) On the 30-minute timeframe, trades based on MACD signals are only advisable amidst substantial volatility and an established trend, confirmed either by a trendline or trend channel.
6) If two levels lie closely together (ranging from 5 to 15 pips apart), they should be considered as a support or resistance zone.
Support and Resistance price levels can serve as targets when buying or selling. You can place Take Profit levels near them.
Red lines represent channels or trend lines, depicting the current market trend and indicating the preferable trading direction.
The MACD(14,22,3) indicator, encompassing both the histogram and signal line, acts as an auxiliary tool and can also be used as a signal source.
Significant speeches and reports (always noted in the news calendar) can profoundly influence the price dynamics. Hence, trading during their release calls for heightened caution. It may be reasonable to exit the market to prevent abrupt price reversals against the prevailing trend.
Beginners should always remember that not every trade will yield profit. Establishing a clear strategy coupled with sound money management is the cornerstone of sustained trading success.
Le recensioni analitiche di InstaForex ti renderanno pienamente consapevole delle tendenze del mercato! Essendo un cliente InstaForex, ti viene fornito un gran numero di servizi gratuiti per il trading efficiente.


