 Rimani
Condizioni di trading
Strumenti


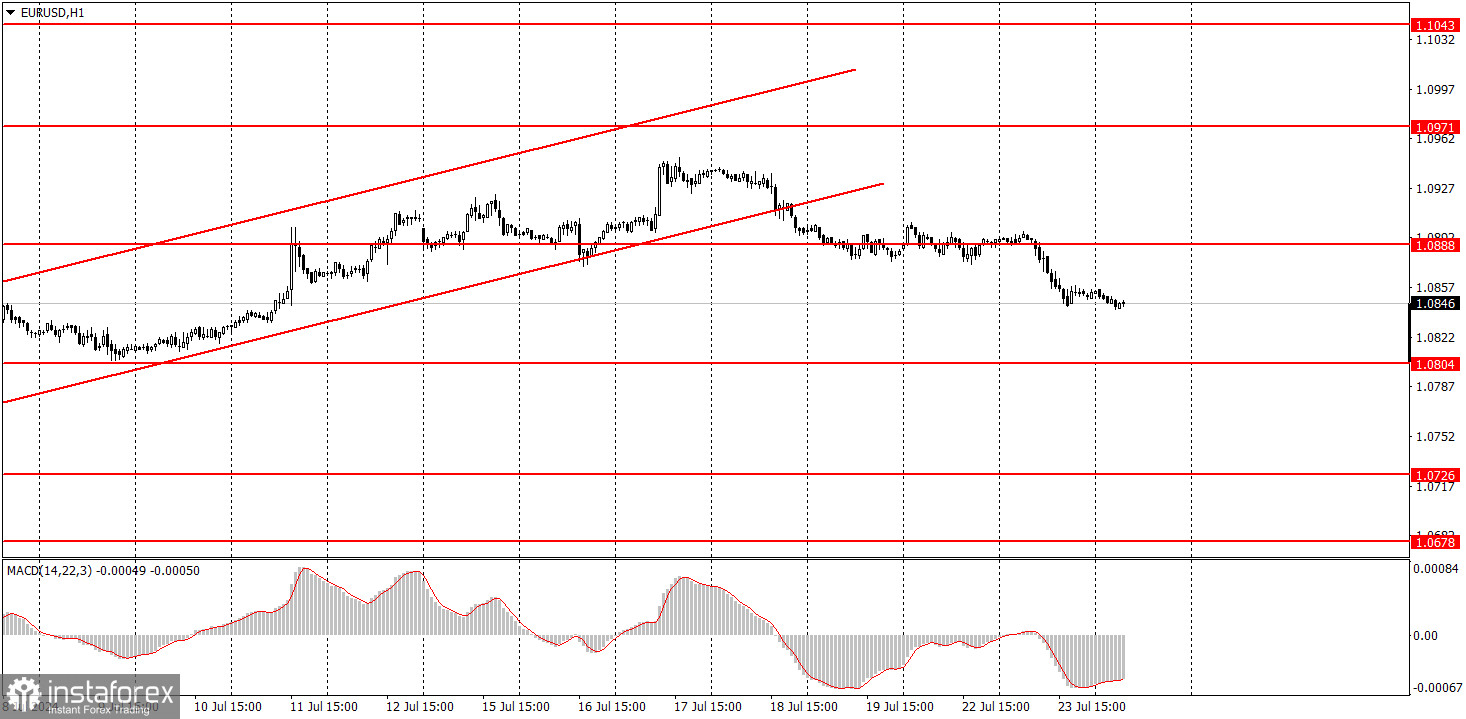
EUR/USD maintained a bearish trend on Monday and Tuesday. There were no market movements on the first day of the week, nor was there any macroeconomic or fundamental backdrop. Volatility was low. On Tuesday, the market slightly recovered and continued declining, although volatility remained low, and there was a lack of fundamental and macroeconomic news. It is worth noting that the pair left the ascending channel last week, so the most logical scenario now is a decline. We have also repeatedly mentioned that we have a long-term flat on the daily timeframe. Last week, the euro reached the upper area of this long-term flat, so we can expect the euro to fall toward the lower boundary of this flat, which is the 1.0600-1.0650 range.
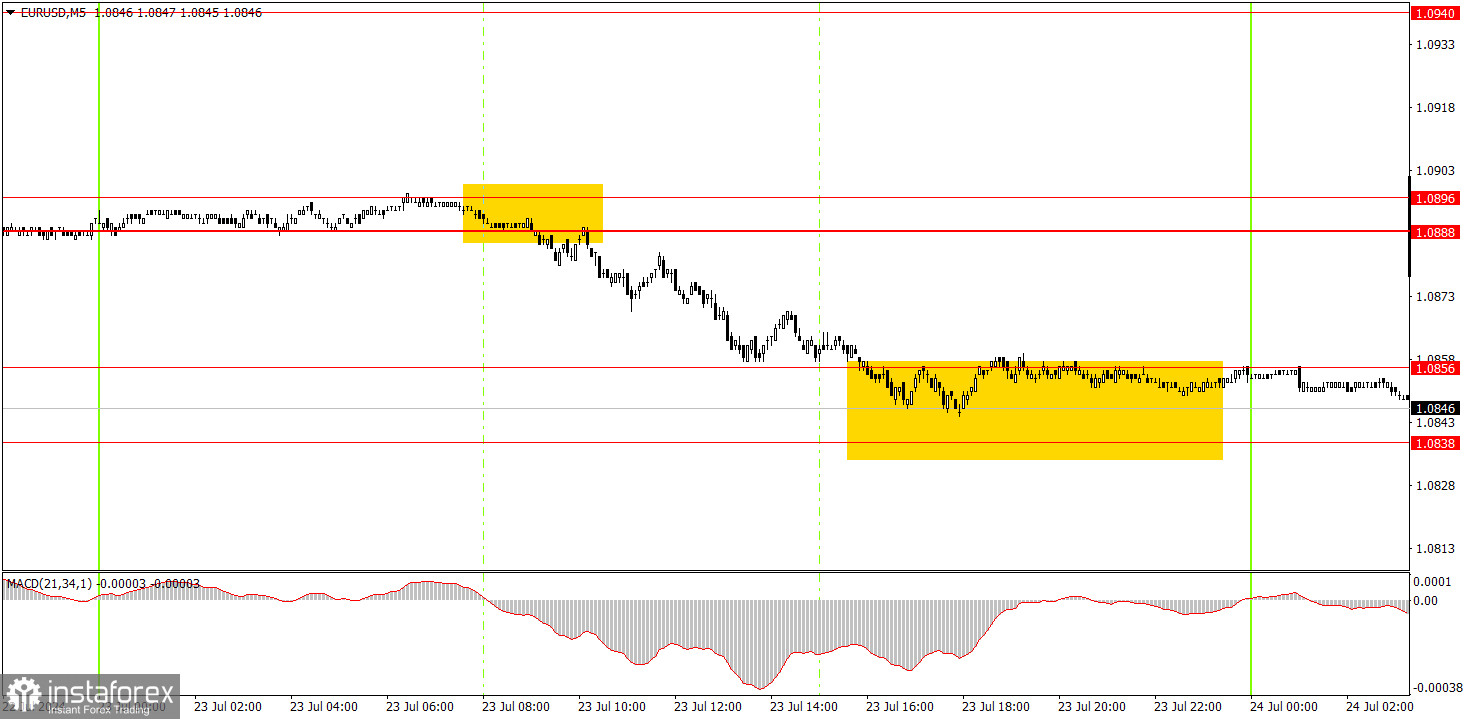
There was a trend in the 5-minute timeframe so that novice traders could open positions. At the beginning of the European trading session, the price bounced from the 1.0888-1.0896 area, and during the US session, it traded in the 1.0838-1.0856 range. Thus, a short position could have yielded about 25 pips. This is an excellent result, given the overall volatility of around 50 pips.
On the hourly timeframe, EUR/USD settled below the ascending channel, allowing it to start a new local downward trend. The euro has fully factored in all the bullish factors, so a significant correction is needed. However, the nature of the movements is best seen in the 24-hour timeframe. It is the same flat range between 1.0650 and 1.1000.
On Wednesday, novice traders may try trading from the 1.0838-1.0856 area. Today, there will be few important events, but at least there are some. The quotes may rise, after which the decline may resume.
The key levels to consider on the 5M timeframe are 1.0526, 1.0568, 1.0611, 1.0678, 1.0726-1.0733, 1.0797-1.0804, 1.0838-1.0856, 1.0888-1.0896, 1.0940, and 1.0971-1.0981. Today, the EU, Germany, and the US will release July Services and Manufacturing PMI data. The ISM business activity indices are more important for the US, so the focus should be on the European indicators.
1) The strength of a signal is determined by the time it took for the signal to form (bounce or level breakthrough). The shorter the time required, the stronger the signal.
2) If two or more trades around a certain level are initiated based on false signals, subsequent signals from that level should be ignored.
3) In a flat market, any currency pair can produce multiple false signals or none at all. In any case, it's better to stop trading at the first signs of a flat market.
4) Trades should be opened between the start of the European session and mid-way through the U.S. session. All trades must be closed manually after this period.
5) In the hourly time frame, trades based on MACD signals are only advisable amidst substantial volatility and an established trend, confirmed either by a trendline or trend channel.
6) If two levels are too close to each other (from 5 to 20 pips), they should be considered as a support or resistance zone.
7) After moving 15 pips in the intended direction, the Stop Loss should be set to break-even.
Support and Resistance price levels can serve as targets when buying or selling. You can place Take Profit levels near them.
Red lines represent channels or trend lines that depict the current trend and indicate the preferred trading direction.
The MACD (14,22,3) indicator, encompassing both the histogram and signal line, acts as an auxiliary tool and can also be used as a source of signals.
Important speeches and reports (always noted in the news calendar) can profoundly influence the price dynamics. Hence, trading during their release calls for heightened caution. It may be reasonable to exit the market to prevent abrupt price reversals against the prevailing trend.
Beginners should always remember that not every trade will yield profit. Establishing a clear strategy, coupled with effective money management, is key to long-term success in trading.
Le recensioni analitiche di InstaForex ti renderanno pienamente consapevole delle tendenze del mercato! Essendo un cliente InstaForex, ti viene fornito un gran numero di servizi gratuiti per il trading efficiente.


