 Rimani
Condizioni di trading
Strumenti


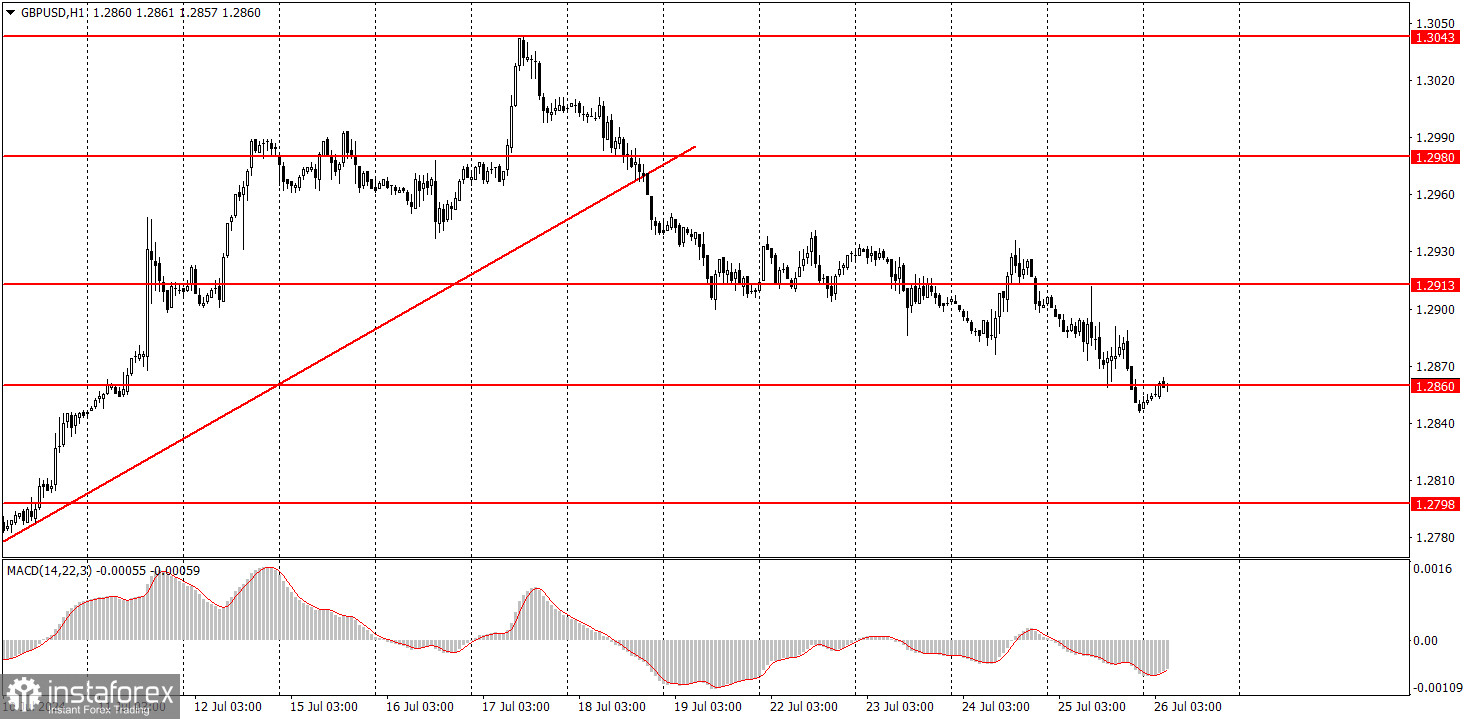
GBP/USD continued its gradual decline on Thursday. The dollar should be appreciating regardless of the macroeconomic backdrop. In the hourly chart, the price has settled below the ascending trend line; the British pound is overbought and unreasonably expensive. It has risen almost without corrections for three months, and the market has already worked out the entire fundamental backdrop in favor of the pound several times. In addition, yesterday's U.S. GDP report showed a more significant increase than expected. Therefore, we believe the U.S. dollar should rise much more strongly than it currently is.
Unfortunately, the market isn't in a rush to sell the pair. The issue seems to be not so much the market's reluctance to sell as its general unwillingness to engage in any transactions. Volatility is not just low; it's low and continuing to decrease.
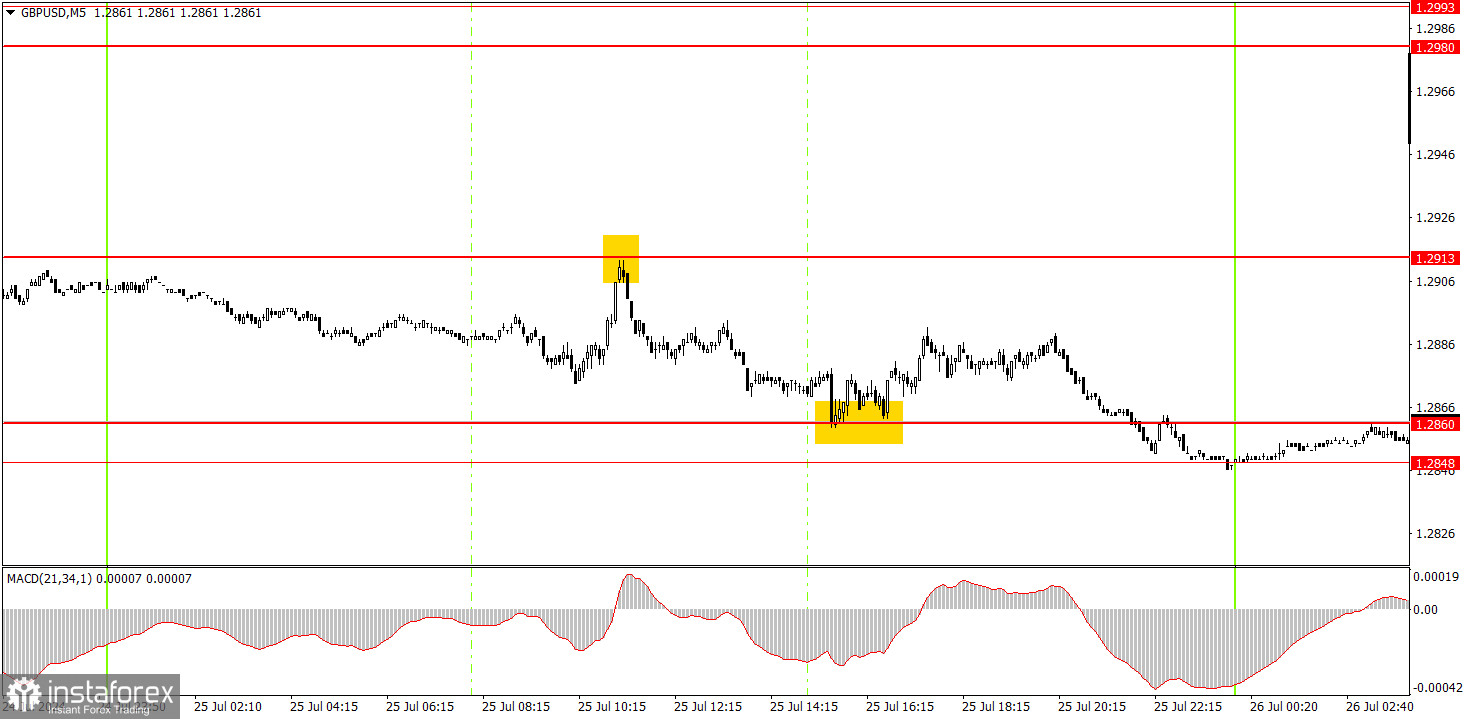
The British pound formed two perfect signals in the 5-minute timeframe. First, the pair bounced off the 1.2913 level, then off the 1.2860 level. The first short position could have yielded about 25 pips in profit, and the second position another ten pips. Given the current volatility and the nature of the movements, this profit is a great result. The pound continues to decline at a sluggish pace.
In the hourly timeframe, GBP/USD finally has a chance of a minor decline. The pair has breached the ascending trendline, so we might see some correction. Ideally, the pound should drop by at least 400-500 pips. The market has processed all the bullish factors multiple times, the dollar is undervalued, and the Bank of England may start lowering its rates soon. The British currency has more reasons to fall than to rise.
On Friday, beginners may trade within the range of 1.2848-1.2860. Unfortunately, the pair's movements remain very weak, with frequent periods of a local flat.
The key levels to consider on the 5M timeframe are 1.2605-1.2633, 1.2684-1.2693, 1.2748, 1.2791-1.2798, 1.2848-1.2860, 1.2913, 1.2980-1.2993, 1.3043, 1.3102-1.3107, 1.3145. Today, no significant events are scheduled in the UK, while in the U.S., reports of medium importance on consumer sentiment, personal income and spending, and the personal consumption expenditures price index will be released. These reports may affect market sentiment, but it is unlikely that we will see movements with volatility above 50 pips today...
1) The strength of a signal is determined by the time it took for the signal to form (bounce or level breakthrough). The shorter the time required, the stronger the signal.
2) If two or more trades around a certain level are initiated based on false signals, subsequent signals from that level should be ignored.
3) In a flat market, any currency pair can produce multiple false signals or none at all. In any case, it's better to stop trading at the first signs of a flat market.
4) Trades should be opened between the start of the European session and mid-way through the U.S. session. All trades must be closed manually after this period.
5) In the hourly time frame, trades based on MACD signals are only advisable amidst substantial volatility and an established trend, confirmed either by a trendline or trend channel.
6) If two levels are too close to each other (from 5 to 20 pips), they should be considered as a support or resistance zone.
7) After moving 15 pips in the intended direction, the Stop Loss should be set to break-even.
Support and Resistance price levels can serve as targets when buying or selling. You can place Take Profit levels near them.
Red lines represent channels or trend lines that depict the current trend and indicate the preferred trading direction.
The MACD (14,22,3) indicator, encompassing both the histogram and signal line, acts as an auxiliary tool and can also be used as a source of signals.
Important speeches and reports (always noted in the news calendar) can profoundly influence the price dynamics. Hence, trading during their release calls for heightened caution. It may be reasonable to exit the market to prevent abrupt price reversals against the prevailing trend.
Beginners should always remember that not every trade will yield profit. Establishing a clear strategy, coupled with effective money management, is key to long-term success in trading.
Le recensioni analitiche di InstaForex ti renderanno pienamente consapevole delle tendenze del mercato! Essendo un cliente InstaForex, ti viene fornito un gran numero di servizi gratuiti per il trading efficiente.
Your IP address shows that you are currently located in the USA. If you are a resident of the United States, you are prohibited from using the services of Instant Trading EU Ltd including online trading, online transfers, deposit/withdrawal of funds, etc.
If you think you are seeing this message by mistake and your location is not the US, kindly proceed to the website. Otherwise, you must leave the website in order to comply with government restrictions.
Why does your IP address show your location as the USA?
Please confirm whether you are a US resident or not by clicking the relevant button below. If you choose the wrong option, being a US resident, you will not be able to open an account with InstaForex anyway.
We are sorry for any inconvenience caused by this message.


