 Rimani
Condizioni di trading
Strumenti


EUR/USD delighted traders with its decent movement on Monday. It is worth mentioning that while the movement wasn't consequential, it was trend-based and more volatile than expected. There were no fundamental or macroeconomic events on Monday, neither in the US nor the EU, yet the market still found reasons to buy the dollar. This is a very positive outcome, as it aligns with our expectations. Let's recall that the pair is trading globally within a horizontal channel of 1.06-1.10. Therefore, we can expect the pair to fall to the lower boundary of this channel.
Unfortunately, economic reports and the Federal Reserve meeting could spoil everything this week. Crucial reports on the labor market, unemployment, and business activity may turn out to be weaker than forecasts. The market may find dovish notes in Fed Chair Jerome Powell's rhetoric, which can pressure the US dollar. However, let's not get ahead of ourselves. So far, everything is shaping up well for the dollar.
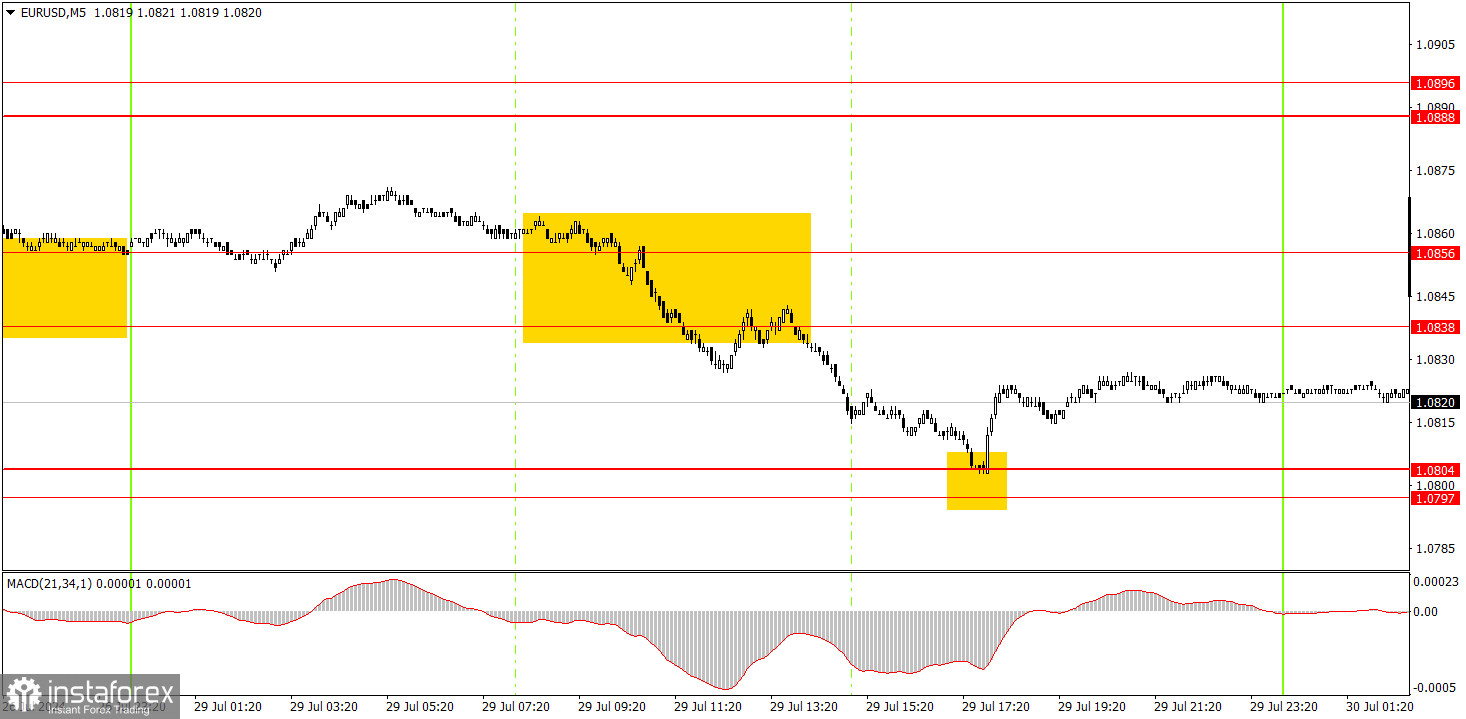
Two trading signals were formed in the 5-minute timeframe on Monday. First, the pair overcame the area of 1.0838-1.0856, and then it bounced off the region of 1.0797-1.0804. Thus, the first short position closed with a profit of about 17 pips and the second with a profit of about ten pips. Overall, as soon as more or less volatile and trend-based movements began, trading signals and profits followed suit.
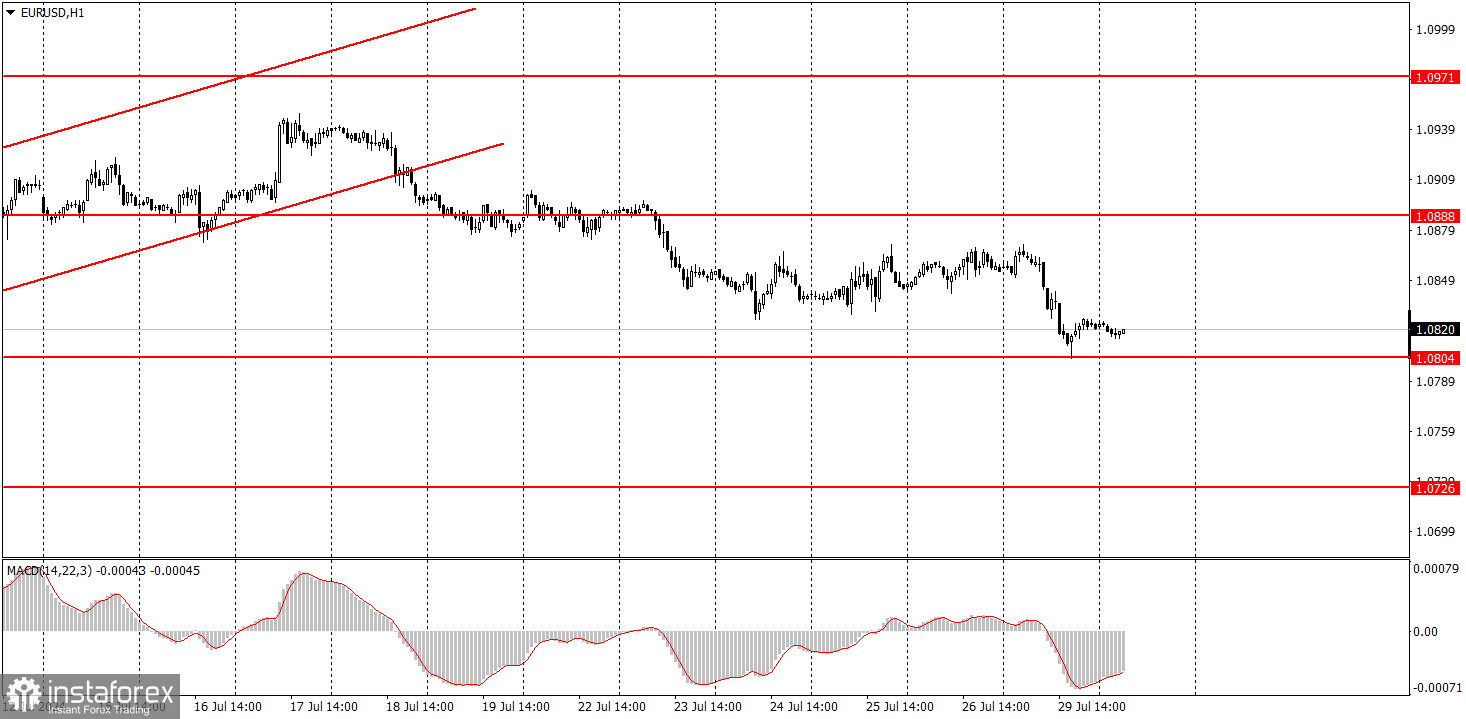
In the hourly time frame, EUR/USD settled below the ascending channel, allowing it to start a new local downward trend. We believe the euro has fully factored in all the bullish factors, so a significant correction is needed. However, the nature of the movements is best seen in the 24-hour timeframe. This is a flat range between 1.0600 and 1.1000. Volatility remains low, and the market has generally stopped reacting to macro data and events.
On Tuesday, novice traders may try to trade from 1.0838-1.0856 or 1.0797-1.0804. There will be plenty of news today, but not all will impact market sentiment.
The key levels to consider on the 5M timeframe are 1.0526, 1.0568, 1.0611, 1.0678, 1.0726-1.0733, 1.0797-1.0804, 1.0838-1.0856, 1.0888-1.0896, 1.0940, and 1.0971-1.0981. Today, the European Union will release GDP reports for Germany and the EU and inflation data for Germany. These reports are important but will likely have a minor impact. The JOLTs report on job openings in the US will be released today.
1) The strength of a signal is determined by the time it took for the signal to form (bounce or level breakthrough). The shorter the time required, the stronger the signal.
2) If two or more trades around a certain level are initiated based on false signals, subsequent signals from that level should be ignored.
3) In a flat market, any currency pair can produce multiple false signals or none at all. In any case, it's better to stop trading at the first signs of a flat market.
4) Trades should be opened between the start of the European session and mid-way through the U.S. session. All trades must be closed manually after this period.
5) In the hourly time frame, trades based on MACD signals are only advisable amidst substantial volatility and an established trend, confirmed either by a trendline or trend channel.
6) If two levels are too close to each other (from 5 to 20 pips), they should be considered as a support or resistance zone.
7) After moving 15 pips in the intended direction, the Stop Loss should be set to break-even.
Support and Resistance price levels can serve as targets when buying or selling. You can place Take Profit levels near them.
Red lines represent channels or trend lines that depict the current trend and indicate the preferred trading direction.
The MACD (14,22,3) indicator, encompassing both the histogram and signal line, acts as an auxiliary tool and can also be used as a source of signals.
Important speeches and reports (always noted in the news calendar) can profoundly influence the price dynamics. Hence, trading during their release calls for heightened caution. It may be reasonable to exit the market to prevent abrupt price reversals against the prevailing trend.
Beginners should always remember that not every trade will yield profit. Establishing a clear strategy, coupled with effective money management, is key to long-term success in trading.
Le recensioni analitiche di InstaForex ti renderanno pienamente consapevole delle tendenze del mercato! Essendo un cliente InstaForex, ti viene fornito un gran numero di servizi gratuiti per il trading efficiente.


