 Rimani
Condizioni di trading
Strumenti


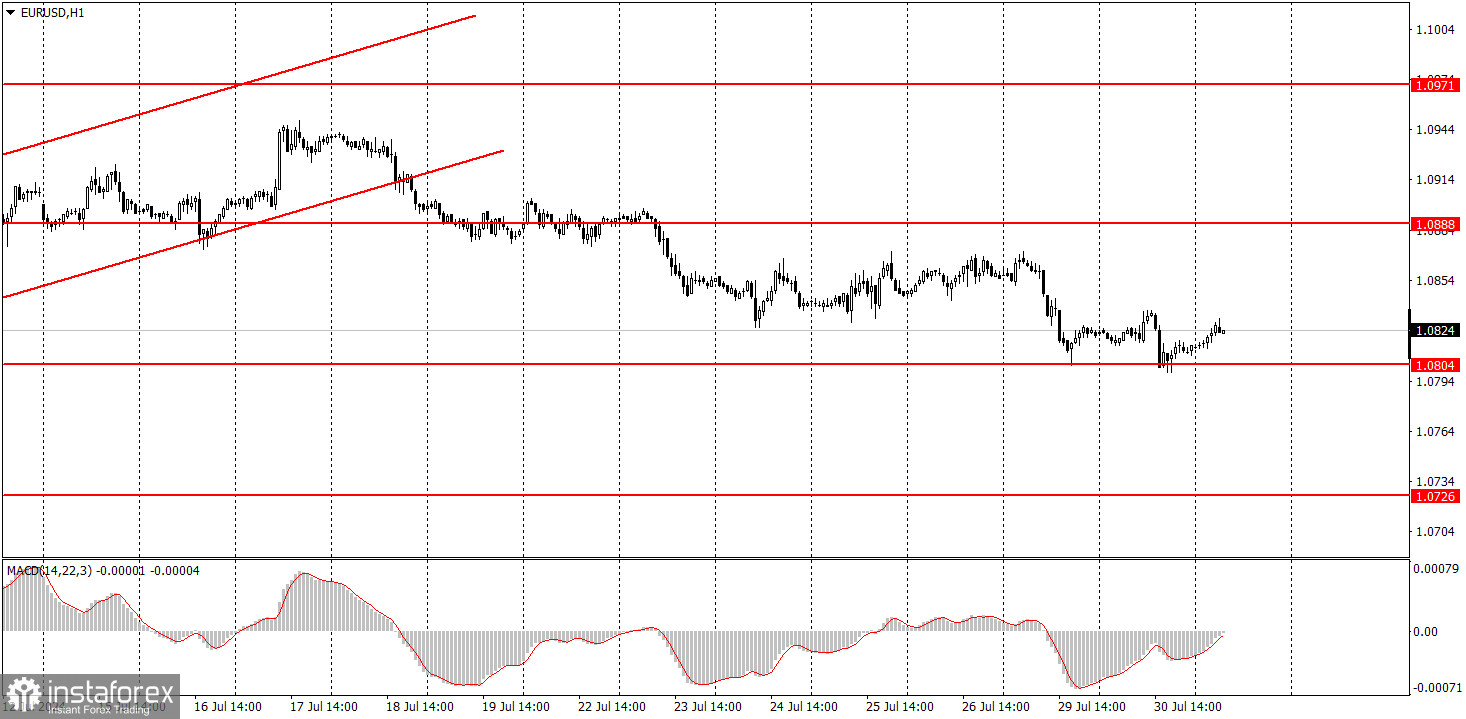
EUR/USD attempted to sustain its decline on Tuesday and tested the 1.0726 level again. Another rebound from this level indicates a potential bullish correction. Overall, the euro continues to fall gradually. Volatility is very low even though the first substantial information of the week started to come in yesterday. The European Union released three reports that deserved attention. The European GDP grew by 0.3% against the forecast of +0.2%, the German GDP contracted by 0.1% against the forecast of +0.1%, and inflation in Germany accelerated to 2.3% against the forecast of 2.2%. Thus, it would have been more logical to see the euro rise yesterday instead of falling. Nevertheless, after testing the upper zone of the horizontal channel 1.0600-1.1000, a decline to the 1.06 level is the most logical outcome. As we can see, macroeconomics and fundamentals do not matter much to the market, which is now inclined towards selling.
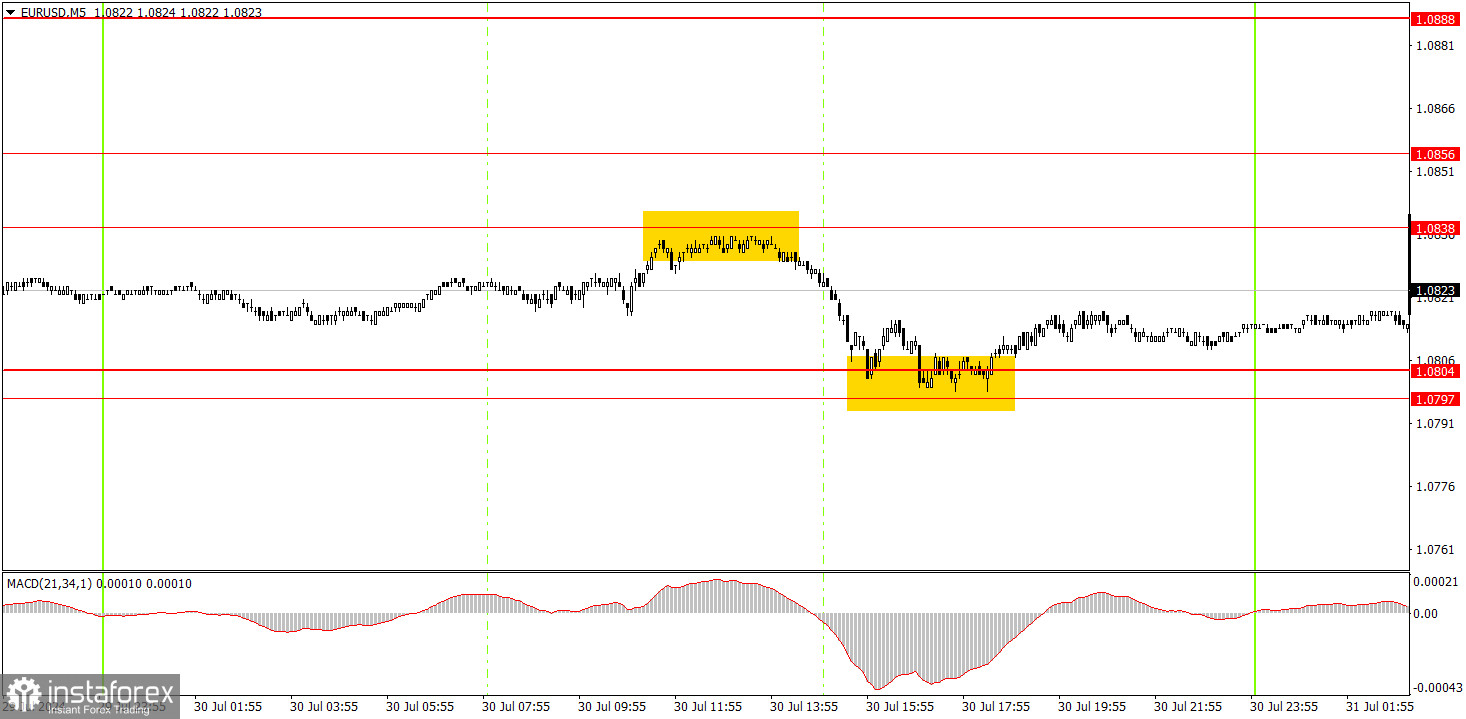
Two trading signals were formed in the 5-minute time frame. First, the pair rebounded from the 1.0838 level with a small margin of error, then it dropped to the nearest target area of 1.0797-1.0804 and bounced off it. The first short position closed with a profit of about 15 pips, and a long position could be opened on the second buy signal, which can be held into Wednesday.
In the hourly time frame, EUR/USD settled below the ascending channel, allowing it to start a new local downward trend. We believe the euro has fully factored in all the bullish factors, so a significant correction is needed. However, the nature of the movements is best seen in the 24-hour timeframe. The pair is flat within the range between 1.0600 and 1.1000. Volatility remains low, and the market has stopped reacting to macro data and events.
On Wednesday, novice traders can stay in long positions with a target of 1.0838 but take note that the local trend is currently downwards. Volatility remains low, and even the macroeconomic background is not helping.
The key levels to consider on the 5M timeframe are 1.0526, 1.0568, 1.0611, 1.0678, 1.0726-1.0733, 1.0797-1.0804, 1.0838-1.0856, 1.0888-1.0896, 1.0940, 1.0971-1.0981. Today, the European Union is scheduled to release an important inflation report, and the U.S. will have a medium-significance ADP report and the Federal Reserve meeting. It might seem that volatility will spike several times today, but in reality, we might see the same weak movements.
1) The strength of a signal is determined by the time it took for the signal to form (bounce or level breakthrough). The shorter the time required, the stronger the signal.
2) If two or more trades around a certain level are initiated based on false signals, subsequent signals from that level should be ignored.
3) In a flat market, any currency pair can produce multiple false signals or none at all. In any case, it's better to stop trading at the first signs of a flat market.
4) Trades should be opened between the start of the European session and mid-way through the U.S. session. All trades must be closed manually after this period.
5) In the hourly time frame, trades based on MACD signals are only advisable amidst substantial volatility and an established trend, confirmed either by a trendline or trend channel.
6) If two levels are too close to each other (from 5 to 20 pips), they should be considered as a support or resistance zone.
7) After moving 15 pips in the intended direction, the Stop Loss should be set to break-even.
Support and Resistance price levels can serve as targets when buying or selling. You can place Take Profit levels near them.
Red lines represent channels or trend lines that depict the current trend and indicate the preferred trading direction.
The MACD (14,22,3) indicator, encompassing both the histogram and signal line, acts as an auxiliary tool and can also be used as a source of signals.
Important speeches and reports (always noted in the news calendar) can profoundly influence the price dynamics. Hence, trading during their release calls for heightened caution. It may be reasonable to exit the market to prevent abrupt price reversals against the prevailing trend.
Beginners should always remember that not every trade will yield profit. Establishing a clear strategy, coupled with effective money management, is key to long-term success in trading.
Le recensioni analitiche di InstaForex ti renderanno pienamente consapevole delle tendenze del mercato! Essendo un cliente InstaForex, ti viene fornito un gran numero di servizi gratuiti per il trading efficiente.


