 Rimani
Condizioni di trading
Strumenti


EUR/USD
Analysis:
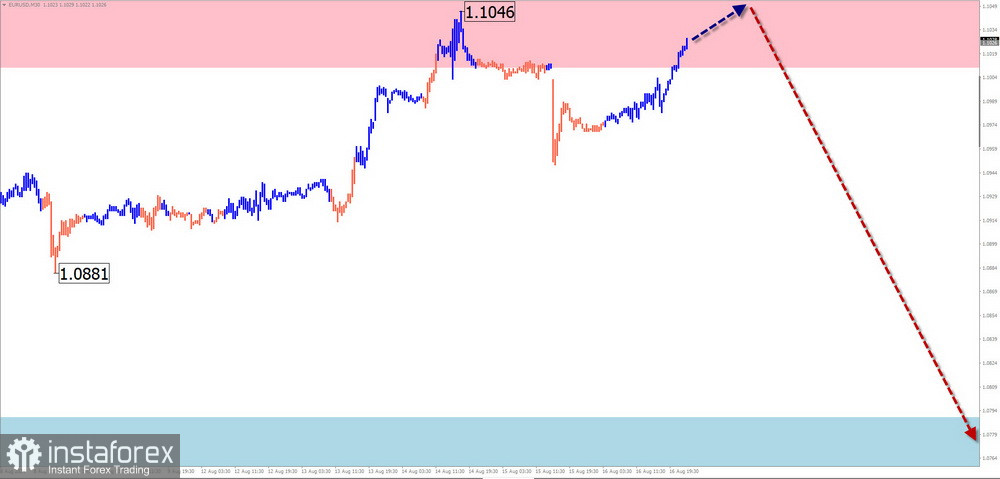
The chart for the major pair of the European currency continues to show a complex corrective pattern. At the time of analysis, the shape of its extremes most closely resembles a shifting plane. The segment of movement that began on June 14 is still incomplete and is moving upwards. The lower boundary of a potential reversal zone on the weekly scale chart passes at the resistance level. It will be difficult for the price to break through this level on the first attempt.
Forecast:
Throughout the upcoming week, the euro's price is expected to move within a channel between the nearest support and resistance zones. In the first few days, pressure on resistance can be expected. A brief break of the upper boundary is possible. Afterward, a reversal and the beginning of a decline can be expected.
Potential Reversal Zones
Resistance: 1.1010/1.1060Support: 1.0790/1.0740
Recommendations:
Sales: May be used for trading after confirmed signals in the resistance area. Be mindful of the limited potential for the upcoming decline.Purchases: Do not have potential.
USD/JPY
Analysis:
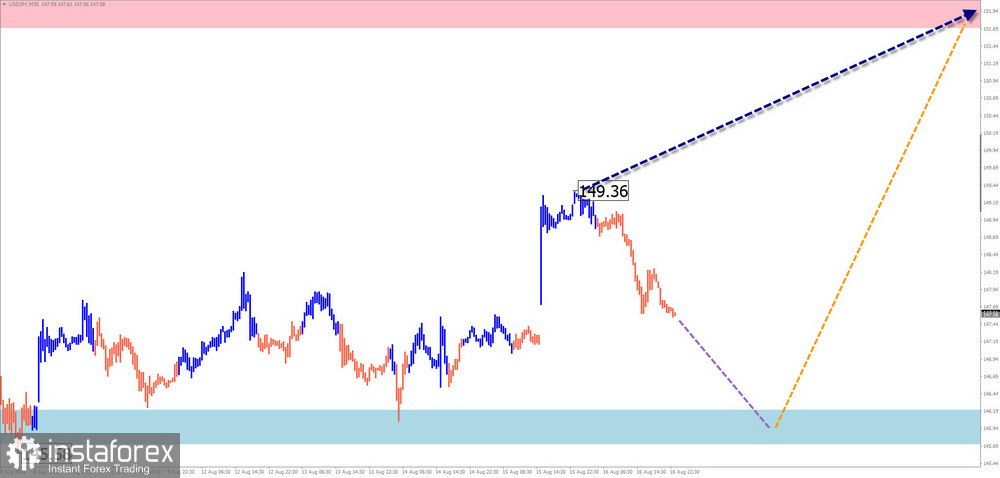
The upward trend that began on August 5 continues to develop on the Japanese yen chart. Two weeks ago, prices broke through the resistance zone on the daily chart. In the following days, the price consolidated above it, forming an intermediate correction. This movement is nearing completion. No signs of an imminent reversal are observed on the chart.
Forecast:
At the beginning of the upcoming week, a sideways movement along the support zone can be expected. The upward trend is likely to resume and intensify in the second half of the week. If there is a change in direction, a sharp increase in volatility cannot be ruled out.
Potential Reversal Zones
Resistance: 151.70/152.20Support: 146.20/145.70
Recommendations:
Sales: There are no conditions for selling in the Japanese yen market.Purchases: May be used in trades after confirmed signals from your trading systems at the end of the current decline.
GBP/JPY
Analysis:
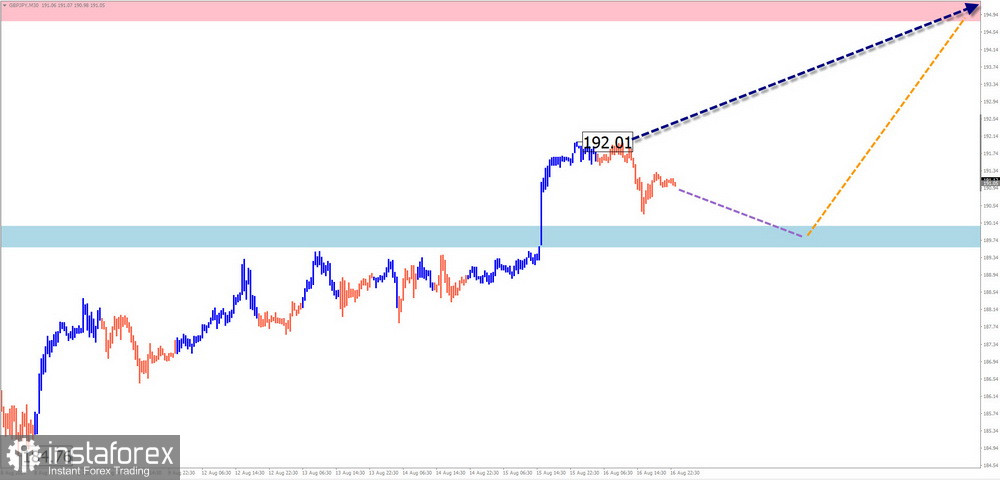
On the chart of the British pound/Japanese yen, the upward trend that began two weeks ago continues in the short term. Its unfinished segment has been developing since the end of July. After breaking through intermediate resistance, prices have been pulling back, forming a correction. This zone has now turned into support.
Forecast:
During the upcoming weekly period, a gradual increase in the pair rate to the resistance zone can be expected. At the beginning of the week, a brief decline in price is possible, down to the calculated support.
Potential Reversal Zones
Resistance: 194.80/195.30Support: 190.10/189.60
Recommendations:
Sales: May be used within intraday trading after confirmed signals from your trading systems in the resistance zone.Purchases: Risky and have little potential.
USD/CAD
Analysis:
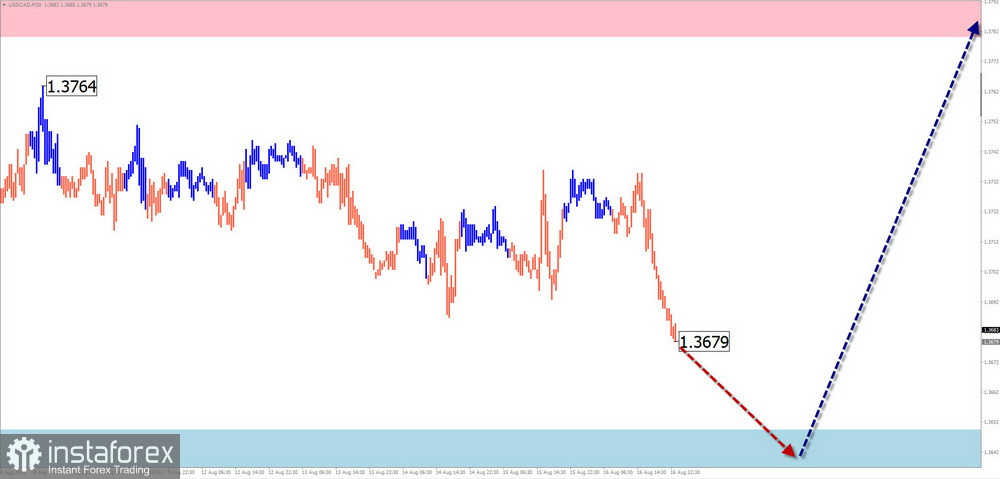
After a period of strengthening the U.S. dollar relative to the Canadian currency, the pair's prices have entered a prolonged correction since April this year. The chart's extremes have formed an extended sideways movement. Analysis of the structure shows the formation of the final segment (C). The price is approaching the upper boundary of the preliminary target zone.
Forecast:
Throughout the upcoming week, the downward movement vector is expected to continue until it is fully completed in the support zone. Then, a sideways movement in the prices can be expected, creating conditions for a reversal. The chance of a change in the direction of price movement may appear by the end of the week.
Potential Reversal Zones
Resistance: 1.3780/1.3830Support: 1.3650/1.3600
Recommendations:
Purchases: After the appearance of corresponding signals in the support zone, they will become relevant for trading.Sales: Can be used with a reduced volume within individual sessions. Potential is limited by support.
NZD/USD
Analysis:
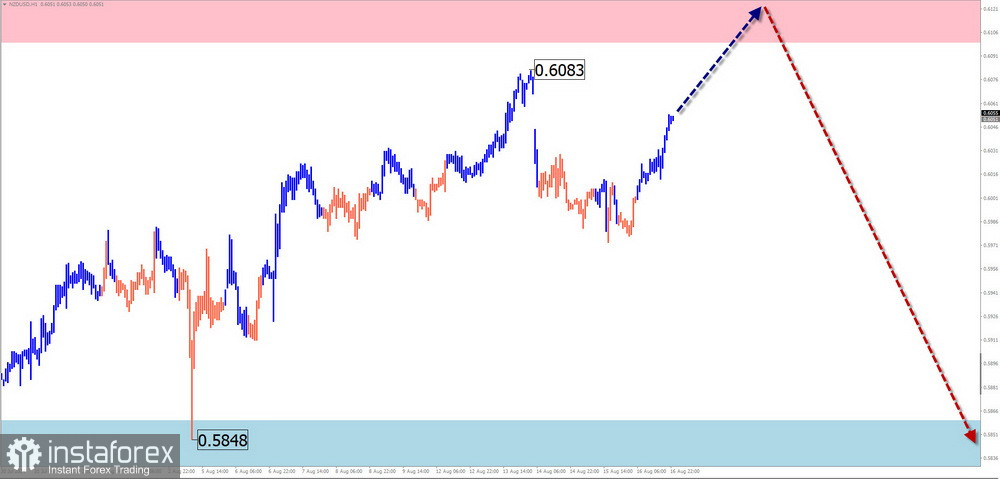
On the chart of the major pair of the New Zealand dollar, the main course in the short term is set by the downward trend that began in December last year. The unfinished segment in the opposite direction from July 29 has an impulsive character. Analysis of the wave structure shows a potential reversal.
Forecast:
In the upcoming week, a general sideways movement is expected. At the beginning of the week, brief pressure on the resistance zone cannot be ruled out. A course change is possible at the end of the week. The highest volatility is likely in the second half.
Potential Reversal Zones
Resistance: 0.6100/0.6150Support: 0.5860/0.5810
Recommendations:
Purchases: High risk and no potential until the current decline is completed.Sales: Possible if entered at the end of counter-retracements. Potential is limited by the support zone.
Gold
Analysis:
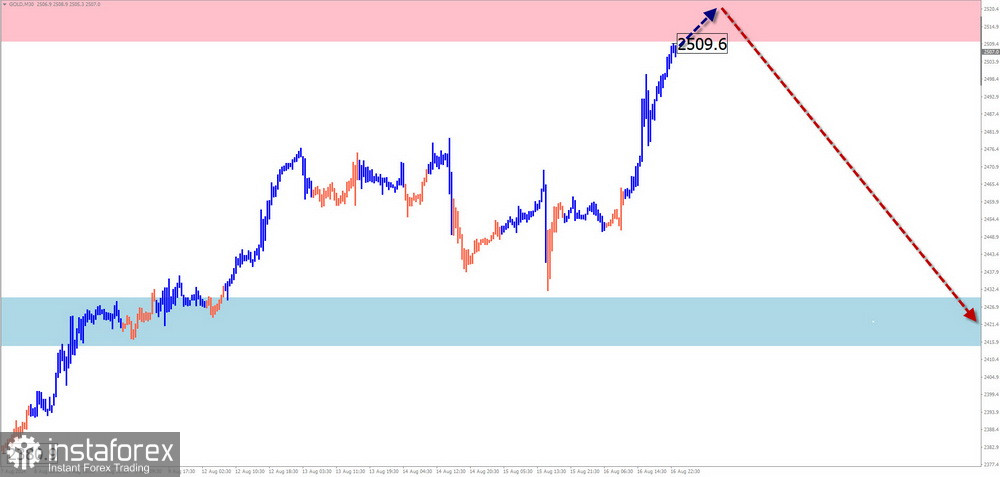
The upward trend in gold that started in October last year continues to move prices "north" on the chart. The wave structure forms a broad sideways movement. Analysis shows the proximity to the completion of the middle part. The final segment (C) is still missing. The target resistance zone lies at the lower boundary of a powerful potential reversal zone on the weekly timeframe.
Forecast:
In the first half of the upcoming week, pressure on the resistance zone is expected. A sideways pause and reversal can be expected in this zone. A counter-reduction is more likely by the end of the week.
Potential Reversal Zones
Resistance: 2510.0/2530.0Support: 2430.0/2410.0
Recommendations:
Sales: Will become available after confirmed reversal signals in the resistance zone.Purchases: High risk and no potential.
Bitcoin
Analysis:
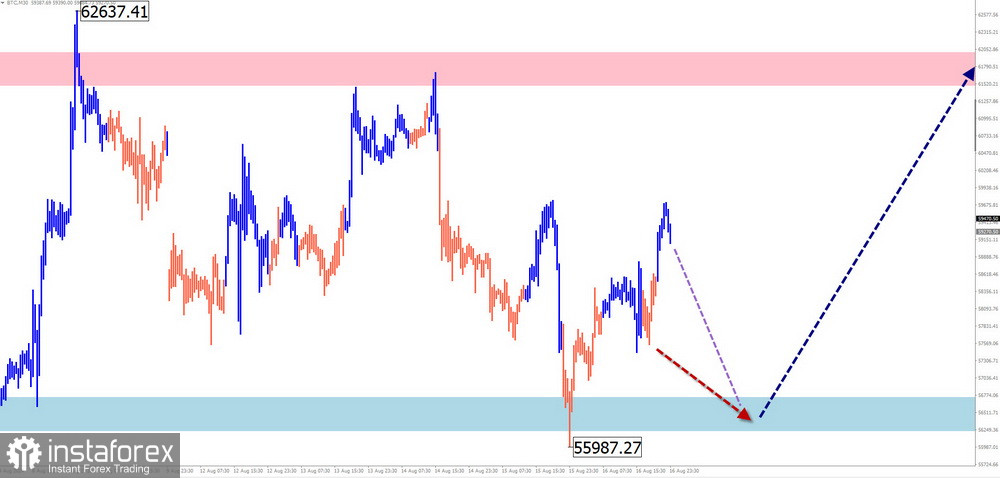
The downward wave over the past month and a half has brought Bitcoin's prices to a strong support area of the largest scale. Since August 5, the coin's price has changed direction from a strong support level. The wave level of the movement exceeds the scale of the correction of the last segment of the trend wave.
Forecast:
In the coming days, a continuation of the general sideways movement is expected. A decline is likely until the support zone. Then a sideways move, creating conditions for a reversal, can be expected. The resumption of growth is possible at the end of the week or later.
Potential Reversal Zones
Resistance: 61500.0/62000.0Support: 56800.0/56300.0
Recommendations:
Sales: Consider the limited potential for a price decline. Trades can be used within individual trading sessions with a fractional volume.Purchases: Will become possible after confirmed signals from your trading systems in the support zone.
Explanations: In simplified wave analysis (SWA), all waves consist of 3 parts (A-B-C). The last, unfinished wave is analyzed on each timeframe. Dashed lines indicate expected movements.
Note: The wave algorithm does not account for the duration of instrument movements over time.
Le recensioni analitiche di InstaForex ti renderanno pienamente consapevole delle tendenze del mercato! Essendo un cliente InstaForex, ti viene fornito un gran numero di servizi gratuiti per il trading efficiente.

