 Rimani
Condizioni di trading
Strumenti


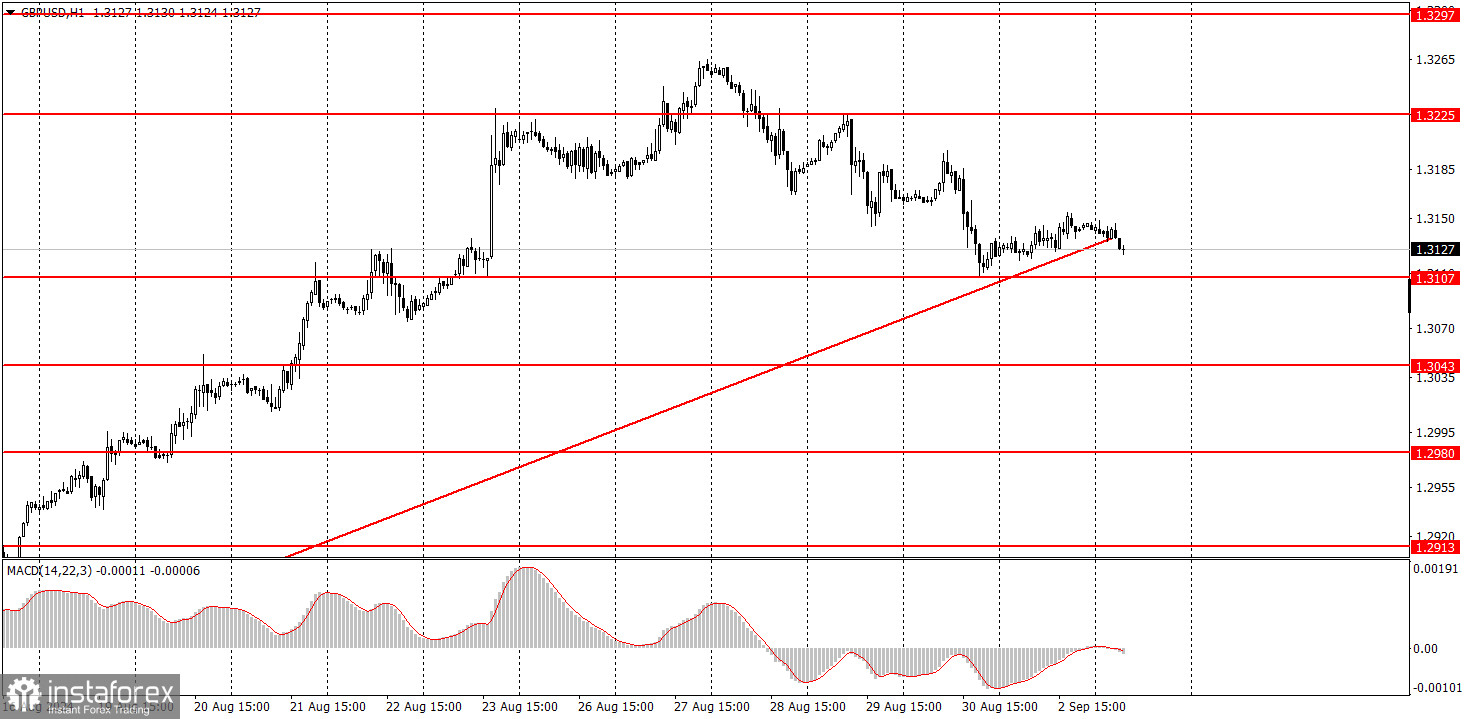
On Monday, the GBP/USD pair also traded with very low volatility and has yet to break through the ascending trendline. The British currency remains reluctant to decline, although it has been rising for a long time and with significant strength, which contradicts common sense. There were no macroeconomic or fundamental events on Monday, so traders had nothing to react to throughout the day. We expect a further decline in the British currency, but the dollar's fate will largely depend on the U.S. labor market and unemployment data this week. Other reports may also provide support or resist the dollar's rise. The first week of each month is the most important for the dollar. A consolidation below the trendline would significantly increase the likelihood of further strengthening the U.S. currency.
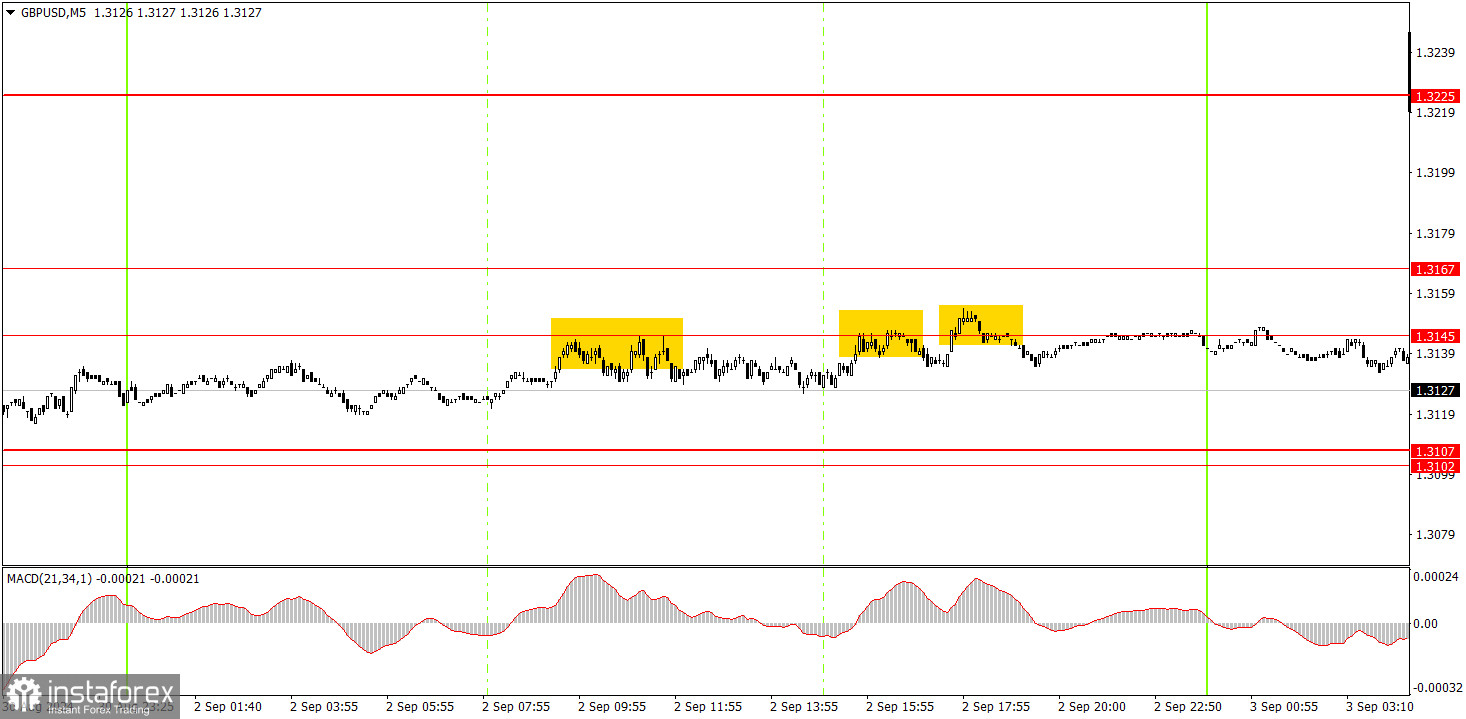
Three trading signals were formed in the 5-minute time frame on Monday. In all three cases, the price bounced off the 1.3145 level. In none of the three instances did it fall by even 20 pips. All three signals were repetitive, so only one short position could have been opened. And it was unlikely to bring a loss, as the price could not consolidate above the 1.3145 level throughout the day.
In the hourly time frame, GBP/USD has a good chance of resuming the global downward trend, but a strong local uptrend is currently in progress, as the price has only just managed to reach the trendline with some difficulty. The British pound remains overbought, the dollar is undervalued, and the market continues to use every opportunity to buy the British currency and sell the dollar. So far, the pound is only showing a minor bearish correction, and it's too early to talk about a full-fledged downtrend.
On Tuesday, the pair might continue to move downward, but the trendline now acts as support rather than a magnet. A rebound from it is possible, while a breakthrough might occur later. The correction in the pound could be slow and weak.
The key levels to consider on the 5M timeframe are 1.2605-1.2633, 1.2684-1.2693, 1.2748, 1.2791-1.2798, 1.2848-1.2860, 1.2913, 1.2980-1.2993, 1.3043, 1.3102-1.3107, 1.3145-1.3167, 1.3225, 1.3272, 1.3310. On Tuesday, no significant events are scheduled in the UK, but an important ISM index of manufacturing activity for August will be released in the U.S. Therefore, volatility might increase somewhat in the second half of the day.
1) The strength of a signal is determined by the time it takes for the signal to form (bounce or level breakthrough). The less time it took, the stronger the signal.
2) If two or more trades around a certain level are initiated based on false signals, subsequent signals from that level should be ignored.
3) In a flat market, any currency pair can form multiple false signals or none at all. In any case, it's better to stop trading at the first signs of a flat market.
4) Trades should be opened between the start of the European session and midway through the U.S. session. After this period, all trades must be closed manually.
5) In the hourly time frame, trades based on MACD signals are only advisable amidst substantial volatility and an established trend confirmed by a trendline or trend channel.
6) If two levels are too close to each other (5 to 20 pips), they should be considered support or resistance.
7) After moving 20 pips in the intended direction, the Stop Loss should be set to break even.
Support and Resistance price levels: targets for opening long or short positions. You can place Take Profit levels near them.
Red lines: channels or trend lines that depict the current trend and indicate the preferred trading direction.
The MACD (14,22,3) indicator, encompassing both the histogram and signal line, acts as an auxiliary tool and can also be used as a source of signals.
Important speeches and reports (always noted in the news calendar) can profoundly influence the movement of a currency pair. Hence, trading during their release calls for heightened caution. It may be reasonable to exit the market to prevent abrupt price reversals against the prevailing trend.
Beginners should always remember that not every trade will yield profit. Developing a clear strategy and effective money management is key to success in trading over a long period.
Le recensioni analitiche di InstaForex ti renderanno pienamente consapevole delle tendenze del mercato! Essendo un cliente InstaForex, ti viene fornito un gran numero di servizi gratuiti per il trading efficiente.


