 Rimani
Condizioni di trading
Strumenti


The EUR/USD pair again traded with low volatility on Tuesday. It seems like the old days were returning when the pair moved only 30-40 pips daily. Hopefully, that's not the case. While there were no significant events on Monday, Tuesday did see the release of the ISM business activity index in the U.S., which is considered an important indicator. Therefore, one could have expected some decent movement during the U.S. session.
However, this index was "neither fish nor fowl." Its value in August rose to 47.2 points, higher than in July but lower than the forecasts. As a result, the market didn't know how to react to this report. Unfortunately, the first U.S. report of the week was once again below traders' expectations. If the other reports also disappoint, the dollar's winning streak could come to a quick end.
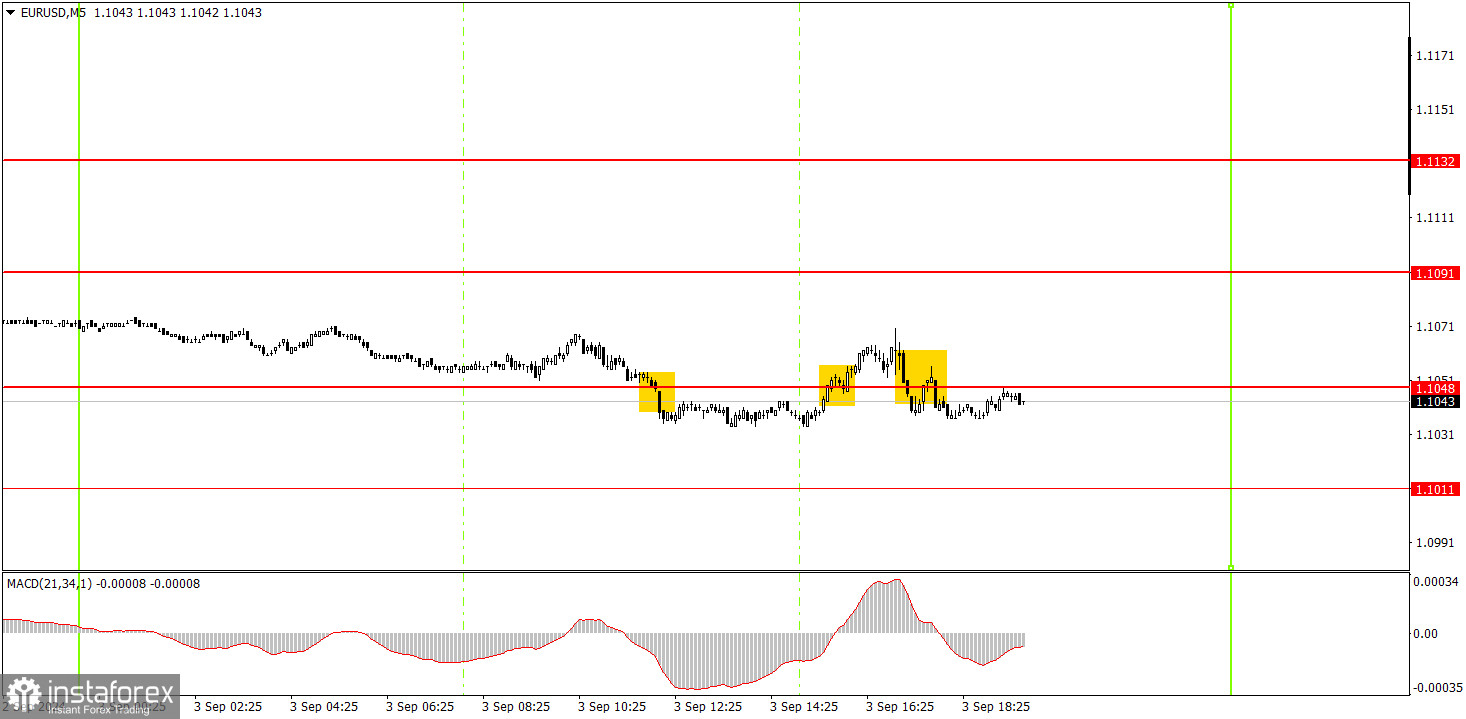
The price traded sideways in the 5-minute time frame for most of the day, so the three trading signals around the 1.1048 level shouldn't be surprising. All three turned out to be false, but it is not the level that is to blame, but the dollar's complete unwillingness to rise despite having all the necessary grounds to do so. However, we warned that this week would depend entirely on U.S. data, and the first report was rather mediocre.
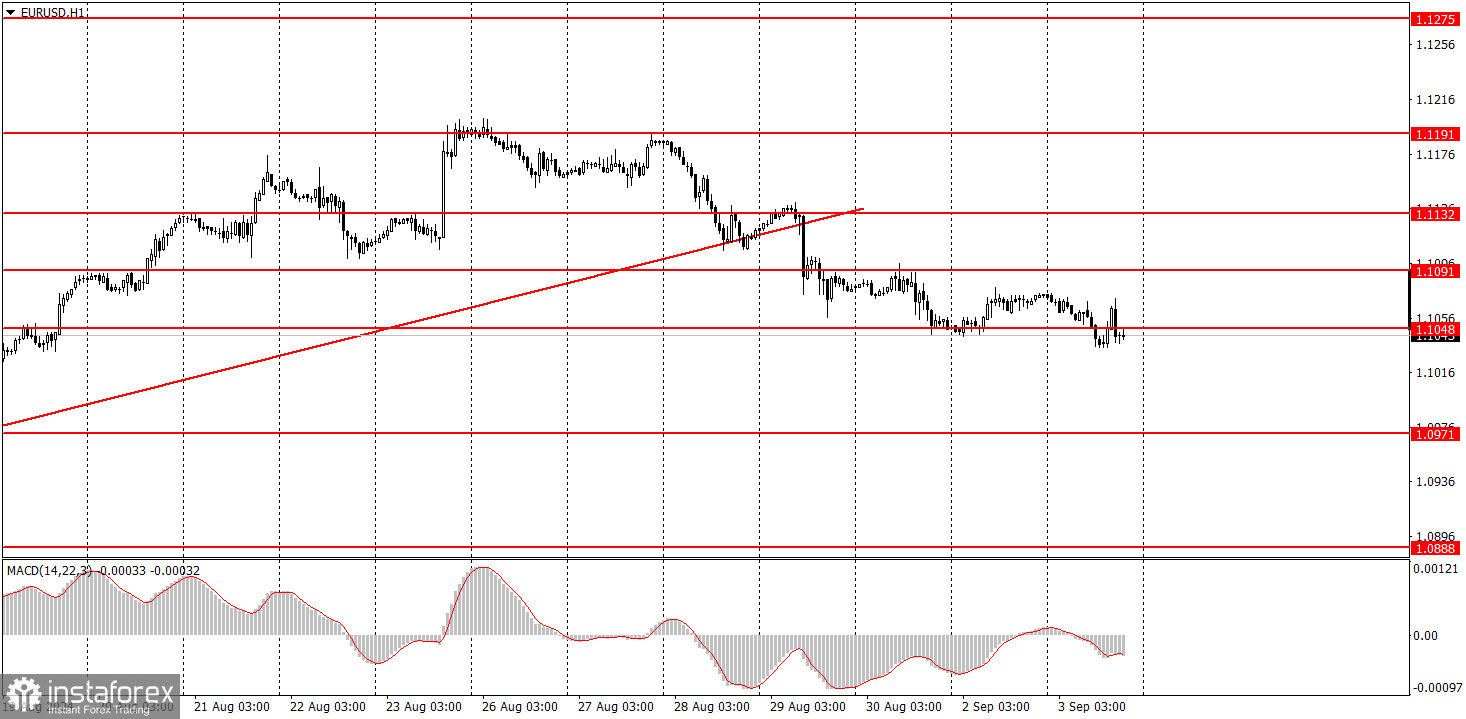
In the hourly time frame, the EUR/USD pair has settled below the ascending trend line and, for the first time in a long while, has a chance to form a downward trend that would be logical and consistent with all factors and types of analysis. Unfortunately, illogical dollar sales could quickly resume after a downward correction, as no one knows how long the market will continue to price in the Federal Reserve's monetary policy easing, which has yet to start. However, the fact remains that the market continues to price in nearly all future Fed rate cuts into the dollar.
On Wednesday, novice traders might again expect a decline, as the price has settled below the 1.1048 level. However, it's probably not worth expecting a strong fall in the pair. We remain skeptical about buying.
The key levels to consider on the 5M time frame are 1.0726-1.0733, 1.0797-1.0804, 1.0838-1.0856, 1.0888-1.0896, 1.0940, 1.0971, 1.1011, 1.1048, 1.1091, 1.1132, 1.1191, and 1.1275-1.1292. On Wednesday, the Eurozone is scheduled to release the final estimate of the August Services PMI. In the U.S., the much more significant JOLTs report on job openings for July will be published.
1) The strength of a signal is determined by the time it takes for the signal to form (bounce or level breakthrough). The less time it took, the stronger the signal.
2) If two or more trades around a certain level are initiated based on false signals, subsequent signals from that level should be ignored.
3) In a flat market, any currency pair can form multiple false signals or none at all. In any case, it's better to stop trading at the first signs of a flat market.
4) Trades should be opened between the start of the European session and midway through the U.S. session. After this period, all trades must be closed manually.
5) In the hourly time frame, trades based on MACD signals are only advisable amidst substantial volatility and an established trend confirmed by a trendline or trend channel.
6) If two levels are too close to each other (5 to 20 pips), they should be considered support or resistance.
7) After moving 15 pips in the intended direction, the Stop Loss should be set to break even.
Support and Resistance price levels: targets for opening long or short positions. You can place Take Profit levels near them.
Red lines: channels or trend lines that depict the current trend and indicate the preferred trading direction.
The MACD (14,22,3) indicator, encompassing both the histogram and signal line, acts as an auxiliary tool and can also be used as a source of signals.
Important speeches and reports (always noted in the news calendar) can profoundly influence the movement of a currency pair. Hence, trading during their release calls for heightened caution. It may be reasonable to exit the market to prevent abrupt price reversals against the prevailing trend.
Beginners should always remember that not every trade will yield profit. Developing a clear strategy and effective money management is key to success in trading over a long period.
Le recensioni analitiche di InstaForex ti renderanno pienamente consapevole delle tendenze del mercato! Essendo un cliente InstaForex, ti viene fornito un gran numero di servizi gratuiti per il trading efficiente.

