 Rimani
Condizioni di trading
Strumenti


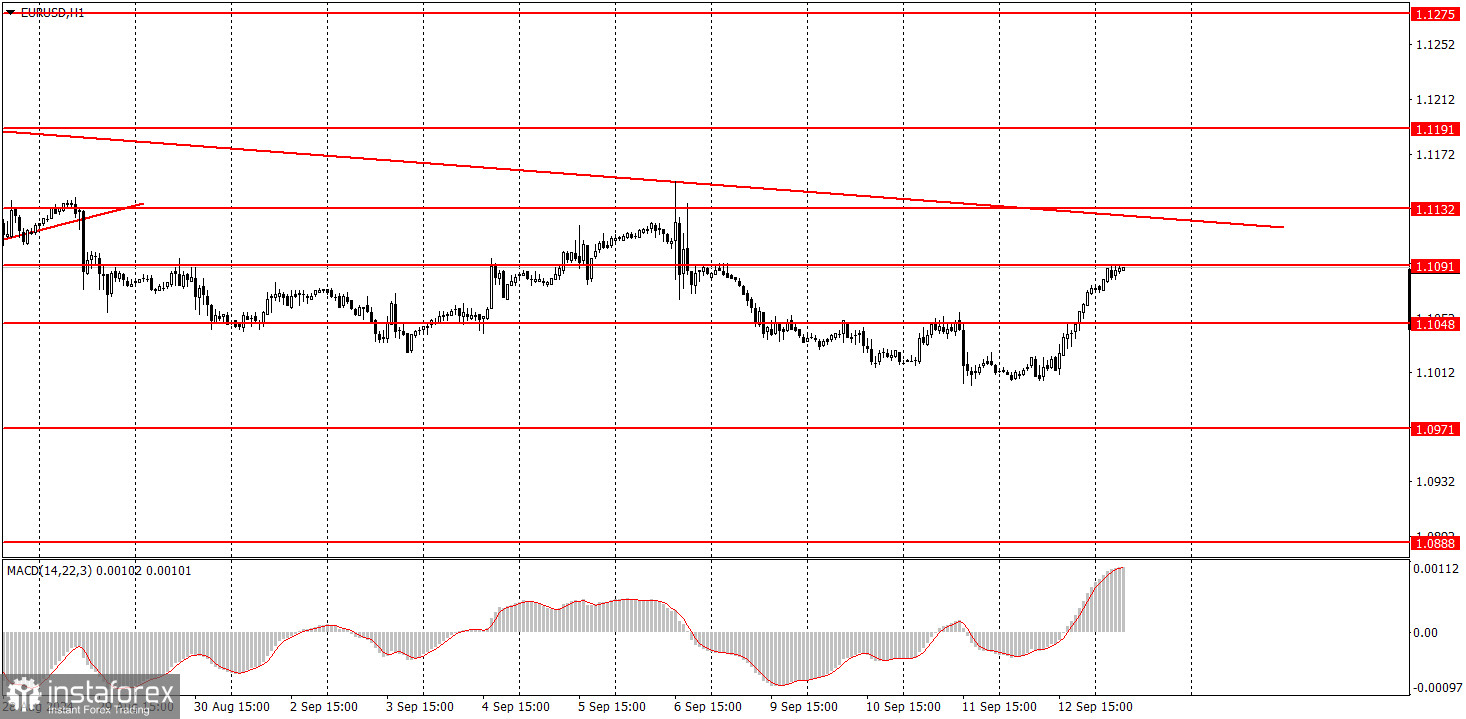
The EUR/USD pair showed a rather unexpected rise on Thursday. Yesterday, the European Central Bank held a meeting where it was decided to lower all three key rates for the second time. Even though the ECB eased its policy exactly as much as the market expected, it is still a matter of easing. Therefore, seeing the euro rise after lowering key rates is simply astonishing. However, traders should have become accustomed to such realities by now. All movements in 2024 follow the same scenario: the euro grows on absolutely any data but occasionally takes pauses for corrections. Recently, we saw a correction lasting several weeks, and it might have seemed that this baseless upward trend would be over. But that wasn't the case—the euro is rising again, even with the ECB lowering rates. The price remains below the trend line for now, but with such market sentiment, this won't last long.
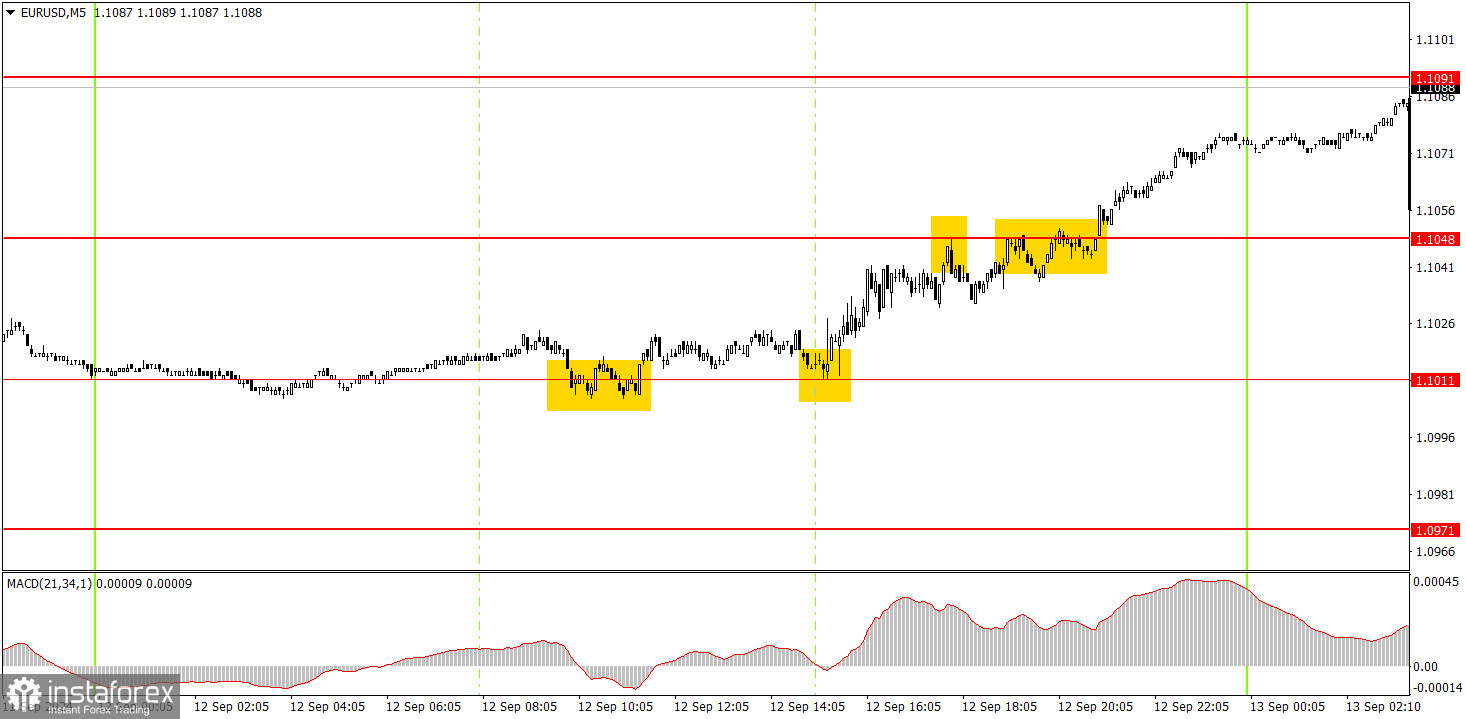
Several trading signals were formed in the 5-minute time frame on Thursday. The price stood still throughout the European session but bounced twice from the 1.1011 level. These signals provided reasons to open long positions. Subsequently, the price reached the 1.1048 mark, where profits could already be taken because there was no reason to expect further euro growth. Nevertheless, the growth continued up to the 1.1091 level.
In the hourly time frame, the EUR/USD pair has, for the first time in a long while, a chance to form a downward trend that would be logical and consistent according to all factors and types of analysis. Unfortunately, illogical dollar sales could quickly resume, as no one knows how long the market will continue to price in the Federal Reserve's monetary policy easing. The market continues to price in all future rate cuts by the Fed into the dollar's value while paying no attention to the ECB's policy easing.
On Friday, novice traders can trade from the 1.1091 level. A bounce from this level would allow for selling, while a breakthrough would signal buying.
The key levels to consider on the 5M time frame are 1.0726–1.0733, 1.0797–1.0804, 1.0838–1.0856, 1.0888–1.0896, 1.0940, 1.0971, 1.1011, 1.1048, 1.1091, 1.1132, 1.1191, and 1.1275–1.1292. For Friday, the Eurozone is scheduled to release a secondary industrial production report, and the U.S. will publish the secondary University of Michigan consumer sentiment index. These data are unlikely to provoke a significant market reaction.
1) The strength of a signal is determined by the time it takes for the signal to form (bounce or level breakthrough). The less time it took, the stronger the signal.
2) If two or more trades were opened around any level due to false signals, subsequent signals from that level should be ignored.
3) In a flat market, any currency pair can form multiple false signals or none at all. In any case, it's better to stop trading at the first signs of a flat market.
4) Trades should be opened between the start of the European session and midway through the U.S. session. After this period, all trades must be closed manually.
5) In the hourly time frame, trades based on MACD signals are only advisable amidst good volatility and a trend confirmed by a trendline or trend channel.
6) If two levels are too close to each other (5 to 20 pips), they should be considered a support or resistance area.
7) After moving 15 pips in the intended direction, the Stop Loss should be set to break even.
Support and Resistance price levels: targets for opening long or short positions. You can place Take Profit levels around them.
Red lines: channels or trend lines that depict the current trend and indicate the preferred trading direction.
The MACD indicator (14,22,3): encompassing both the histogram and signal line, acts as an auxiliary tool and can also be used as a source of signals.
Important speeches and reports (always noted in the news calendar) can profoundly influence the movement of a currency pair. Hence, trading during their release calls for heightened caution. It may be reasonable to exit the market to avoid sharp price reversals against the prevailing movement.
For beginners, it's important to remember that not every trade will yield profit. Developing a clear strategy and effective money management is key to success in trading over the long term.
Le recensioni analitiche di InstaForex ti renderanno pienamente consapevole delle tendenze del mercato! Essendo un cliente InstaForex, ti viene fornito un gran numero di servizi gratuiti per il trading efficiente.


