 Rimani
Condizioni di trading
Strumenti


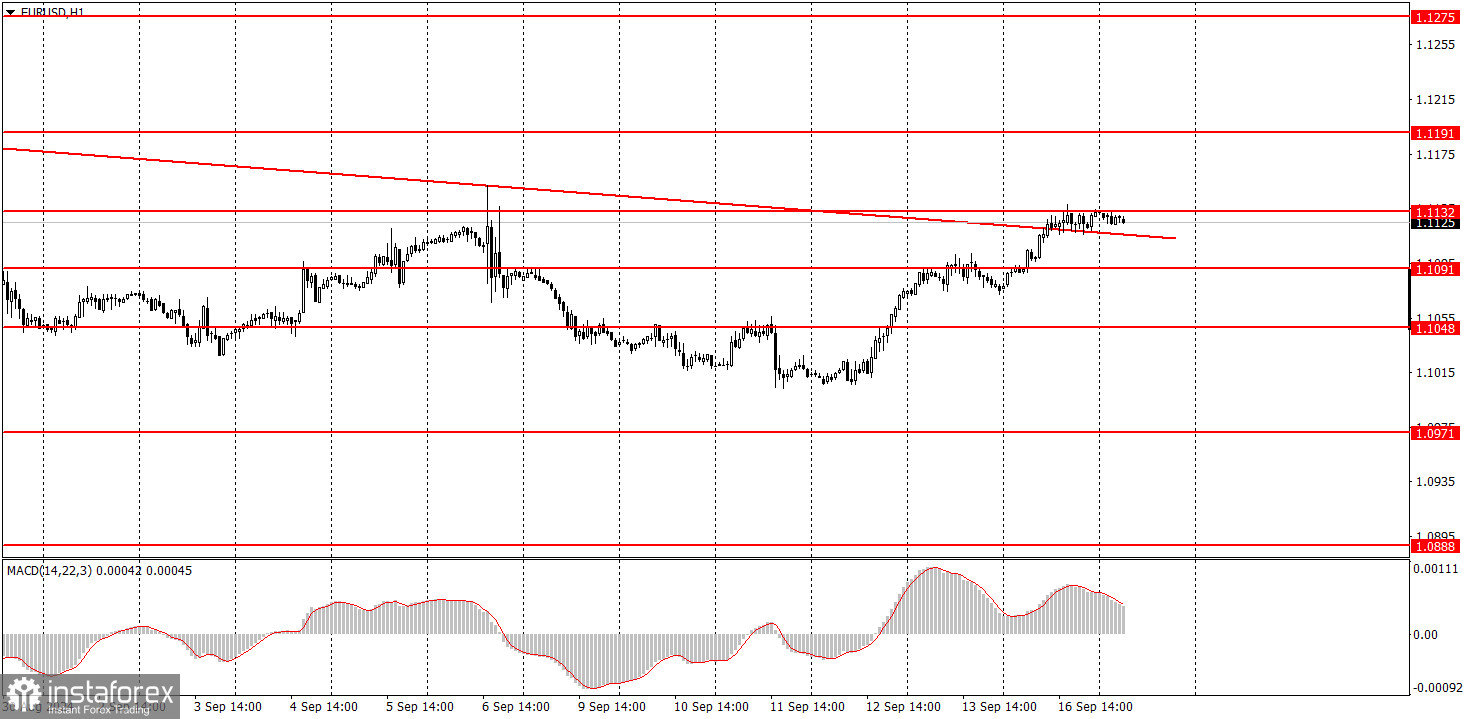
On Monday, the EUR/USD pair showed an unexpected rise, leading to the price breaking above the descending trendline. There would likely have been fewer questions if we had seen such movement on Wednesday or Thursday. However, this happened on Monday, with no significant reports or events. Nevertheless, the market already showed on Monday the direction it intends to trade, or perhaps it is trying to confuse traders ahead of the Federal Reserve meeting. The issue with the Fed meeting is that the market may have already priced in any rate cut scenario because the dollar has been in a downward trend throughout 2024 and, in general, for two years. Therefore, when the Fed lowers the rate on Wednesday, we might see the US dollar rise, just as we saw the euro rise last Thursday when the European Central Bank eased its monetary policy.
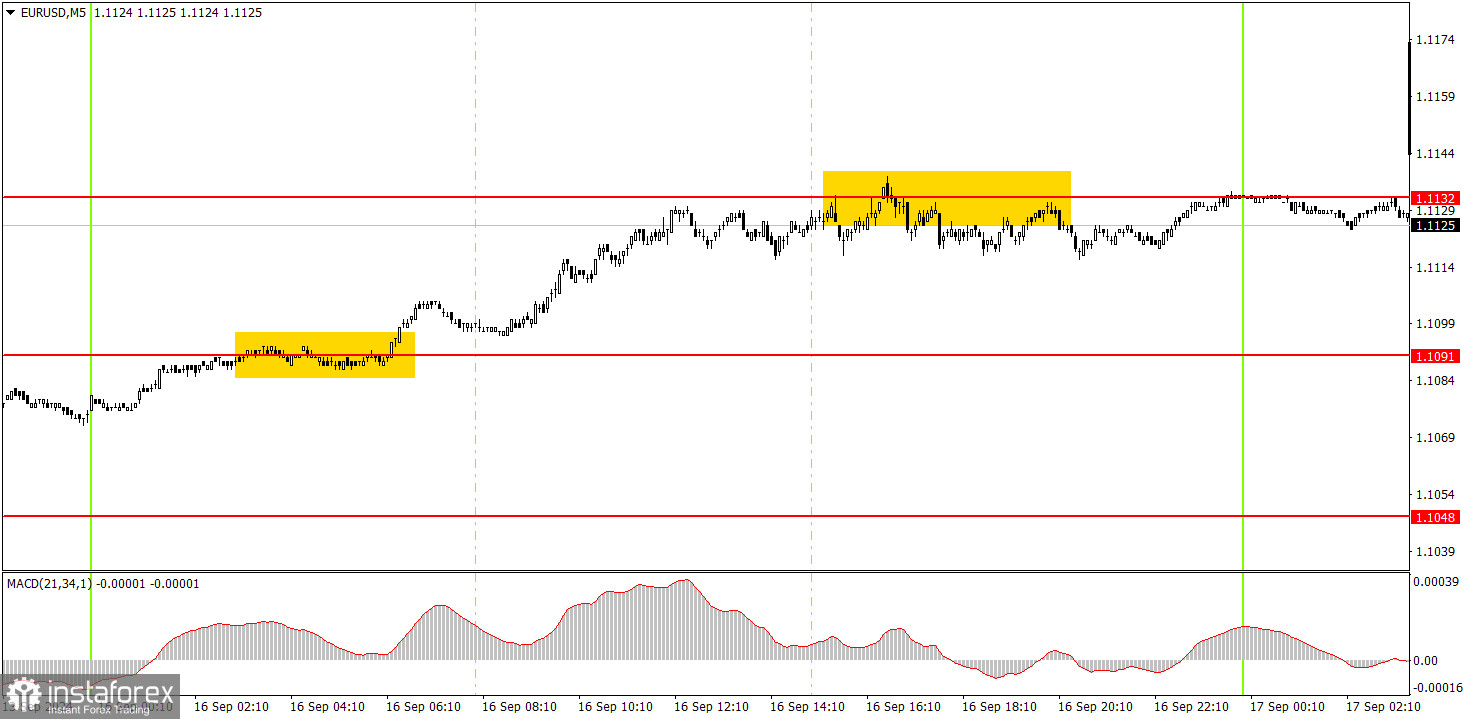
In the 5-minute time frame on Monday, precisely one trading signal was formed. During the Asian trading session, the price broke through the 1.1091 level, allowing novice traders to open long positions at the start of the European session. By the beginning of the US session, the price had reached the nearest target level of 1.1132, where profits could be taken.
In the hourly time frame, the EUR/USD pair can form a downtrend for the first time in a long time, but those chances are quickly fading. Unfortunately, the erratic selling of the dollar may soon resume in the medium term, as no one knows how long the market will continue to price in the Fed's monetary easing. The market is factoring in nearly all future Fed rate cuts for the dollar while mainly ignoring the ECB's policy easing.
On Tuesday, novice traders can trade from the 1.1132 level. A bounce from this level would allow for selling, while a breakthrough would suggest buying. However, once again, the likelihood of a flat movement is high. Yesterday, the pair remained in place throughout the entire U.S. session.
The key levels to consider on the 5M time frame are 1.0726-1.0733, 1.0797-1.0804, 1.0838-1.0856, 1.0888-1.0896, 1.0940, 1.0971, 1.1011, 1.1048, 1.1091, 1.1132, 1.1191, 1.1275-1.1292. On Tuesday, the Eurozone will release the minor ZEW indices, while the US will publish slightly more important reports on industrial production and retail sales. A slight market reaction to these reports is possible.
1) The strength of a signal is determined by the time it takes for the signal to form (bounce or level breakthrough). The less time it took, the stronger the signal.
2) If two or more trades were opened around any level due to false signals, subsequent signals from that level should be ignored.
3) In a flat market, any currency pair can form multiple false signals or none at all. In any case, it's better to stop trading at the first signs of a flat market.
4) Trades should be opened between the start of the European session and midway through the U.S. session. After this period, all trades must be closed manually.
5) In the hourly time frame, trades based on MACD signals are only advisable amidst good volatility and a trend confirmed by a trendline or trend channel.
6) If two levels are too close to each other (5 to 20 pips), they should be considered a support or resistance area.
7) After moving 15 pips in the intended direction, the Stop Loss should be set to break even.
Support and Resistance price levels: targets for opening long or short positions. You can place Take Profit levels around them.
Red lines: channels or trend lines that depict the current trend and indicate the preferred trading direction.
The MACD indicator (14,22,3): encompassing both the histogram and signal line, acts as an auxiliary tool and can also be used as a source of signals.
Important speeches and reports (always noted in the news calendar) can profoundly influence the movement of a currency pair. Hence, trading during their release calls for heightened caution. It may be reasonable to exit the market to avoid sharp price reversals against the prevailing movement.
For beginners, it's important to remember that not every trade will yield profit. Developing a clear strategy and effective money management is key to success in trading over the long term.
Le recensioni analitiche di InstaForex ti renderanno pienamente consapevole delle tendenze del mercato! Essendo un cliente InstaForex, ti viene fornito un gran numero di servizi gratuiti per il trading efficiente.

