 Rimani
Condizioni di trading
Strumenti


On Friday, the EUR/USD pair failed to sustain its upward movement but remained near the last local high reached on Wednesday. The euro rose again throughout the week as the market began to factor in the dovish outcome of the Federal Reserve meeting as early as Monday. Wednesday and Thursday were marked by volatility, but the market had calmed down a bit by Friday. However, "calmed down" does not mean "the selling of the dollar has ended."
A significant event occurred on Wednesday – the Fed initiated monetary policy easing. Now, in a sense, the psychological factor of the dollar's decline has been lifted. Recall that since the beginning of the year, the market began to price in the Fed's rate cuts, which it initially expected back in March. Now, the easing cycle has officially begun. As before, we don't see sufficient reasons for the euro to continue rising, but the price is currently moving regardless of macroeconomic and fundamental factors. It's best to rely on technical analysis.
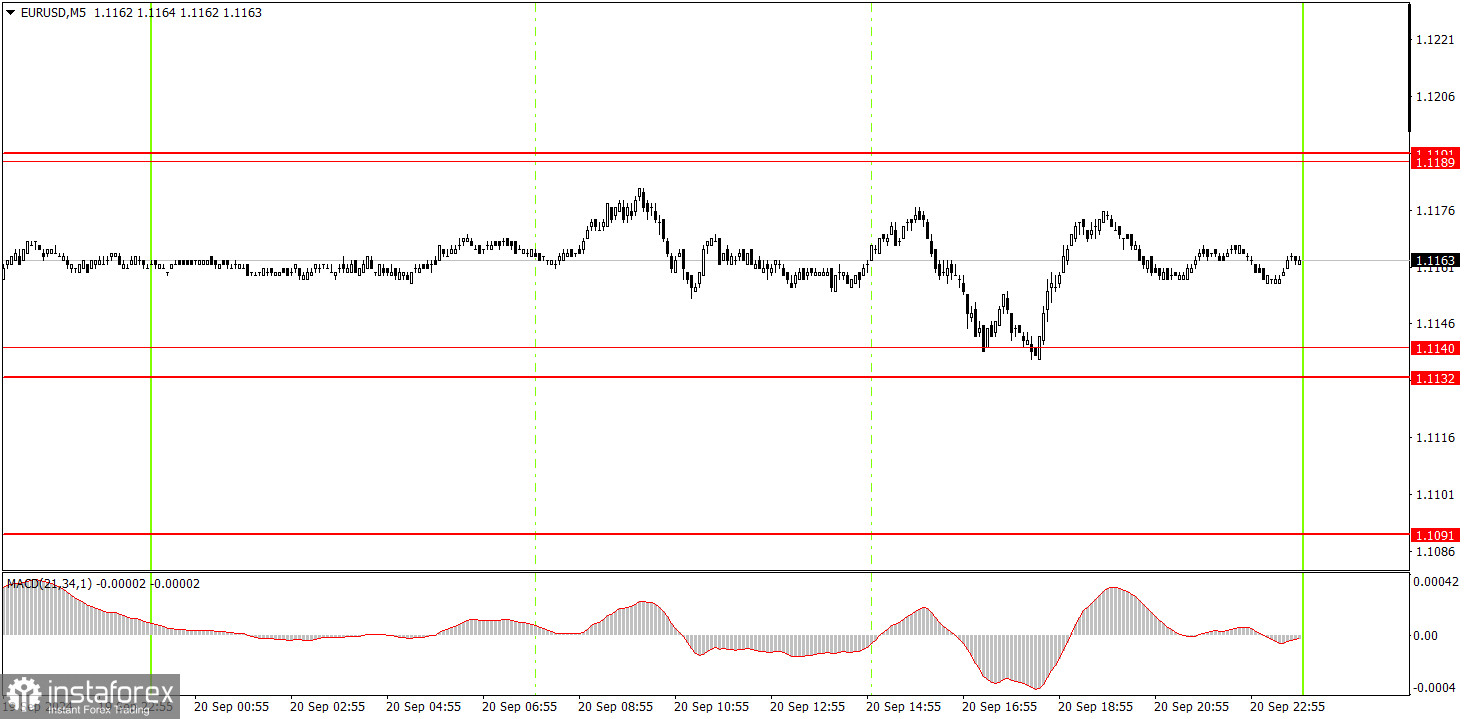
There were no trading signals in the 5-minute time frame on Friday. The price approached the 1.1132 level but did not work through it. The 1.1140 level is new, and it wasn't in place on Friday. Thus, there was no reason to enter the market.
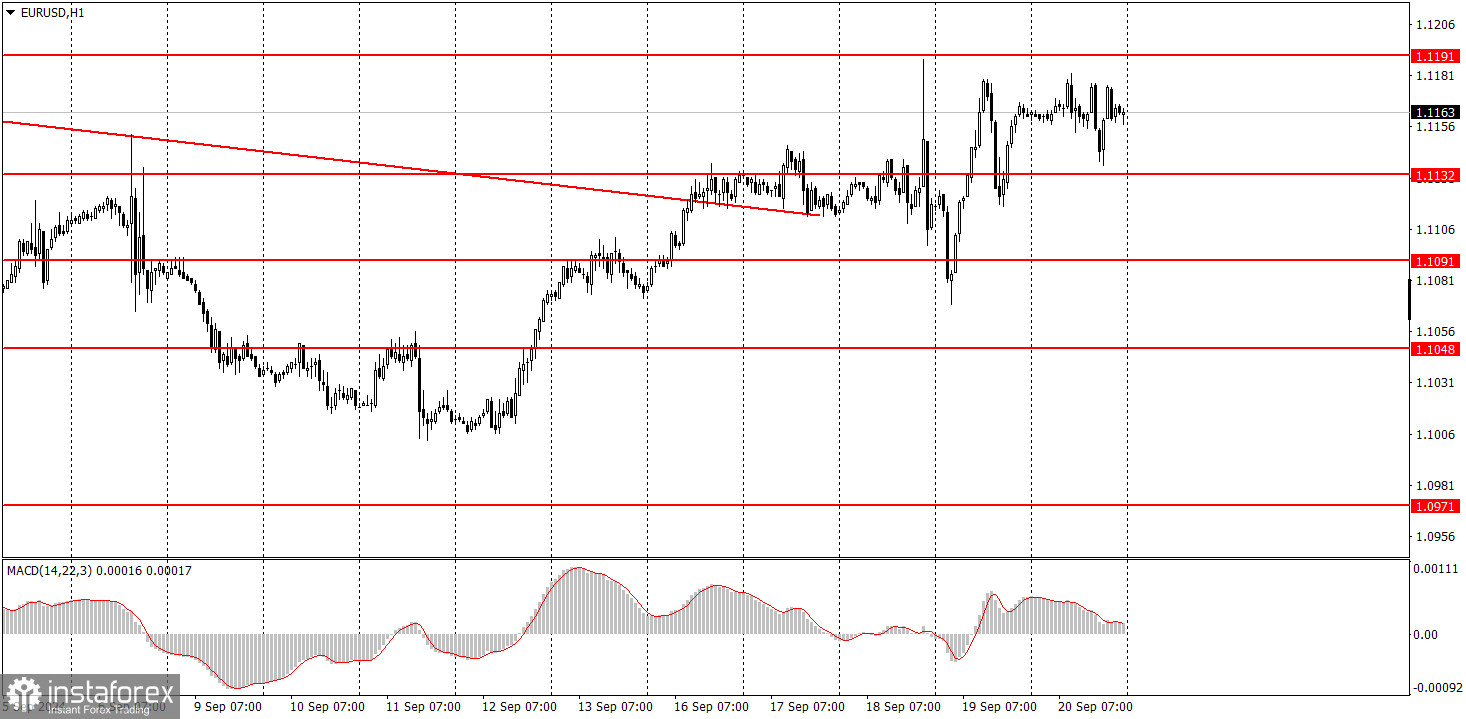
In the hourly time frame, the pair still has a chance to form a downward trend, but those chances are quickly fading. Unfortunately, the illogical selling of the dollar can easily continue in the medium term, as no one knows how much longer the market will price in the Fed's monetary policy easing while ignoring the European Central Bank's easing. The market continues to factor in all potential future Fed rate cuts into the dollar's exchange rate while paying no attention to factors that support the U.S. currency.
On Monday, we can't expect anything other than a bearish correction. The euro remains overbought and unjustifiably expensive. However, trading decisions should be based on technical levels.
The key levels to consider on the 5M time frame are 1.0726-1.0733, 1.0797-1.0804, 1.0838-1.0856, 1.0888-1.0896, 1.0940, 1.0971, 1.1011, 1.1048, 1.1091, 1.1132-1.1140, 1.1189-1.1191, 1.1275-1.1292. On Monday, business activity indices in the services and manufacturing sectors for September (preliminary estimates) will be published in Germany, the Eurozone, and the U.S. These data may trigger a restrained market reaction.
1) The strength of a signal is determined by the time it takes for the signal to form (bounce or level breakthrough). The less time it took, the stronger the signal.
2) If two or more trades were opened around any level due to false signals, subsequent signals from that level should be ignored.
3) In a flat market, any currency pair can form multiple false signals or none at all. In any case, it's better to stop trading at the first signs of a flat market.
4) Trades should be opened between the start of the European session and midway through the U.S. session. After this period, all trades must be closed manually.
5) In the hourly time frame, trades based on MACD signals are only advisable amidst good volatility and a trend confirmed by a trendline or trend channel.
6) If two levels are too close to each other (5 to 20 pips), they should be considered a support or resistance area.
7) After moving 15 pips in the intended direction, the Stop Loss should be set to break even.
Support and Resistance price levels: targets for opening long or short positions. You can place Take Profit levels around them.
Red lines: channels or trend lines that depict the current trend and indicate the preferred trading direction.
The MACD indicator (14,22,3): encompassing both the histogram and signal line, acts as an auxiliary tool and can also be used as a source of signals.
Important speeches and reports (always noted in the news calendar) can profoundly influence the movement of a currency pair. Hence, trading during their release calls for heightened caution. It may be reasonable to exit the market to avoid sharp price reversals against the prevailing movement.
For beginners, it's important to remember that not every trade will yield profit. Developing a clear strategy and effective money management is key to success in trading over the long term.
Le recensioni analitiche di InstaForex ti renderanno pienamente consapevole delle tendenze del mercato! Essendo un cliente InstaForex, ti viene fornito un gran numero di servizi gratuiti per il trading efficiente.

