 Rimani
Condizioni di trading
Strumenti


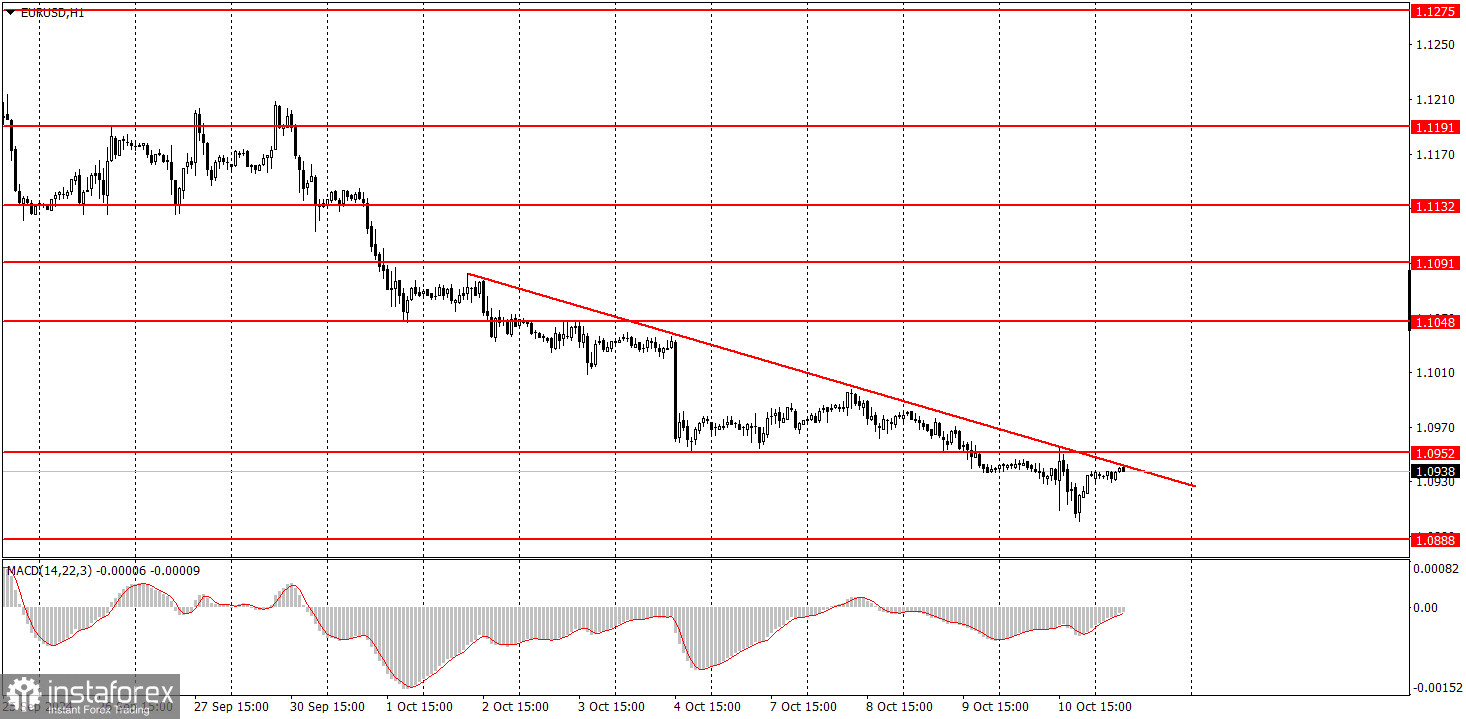
EUR/USD continued to trade lower on Thursday. Throughout the current week, volatility has been lacking, though it did increase slightly yesterday. However, this did not change the nature of the movement. The euro continued to trend downward, but we did not see a strong, decisive drop. The only driver of price yesterday was the U.S. inflation report. We warned that, regardless of the report's outcome, movements could be chaotic and volatile. As a result, following the release of the hawkish inflation report, the pair moved in both directions. On the hourly chart, a downward trend line has formed, but it mainly indicates the general direction of movement. However, breaking above this line could signal the beginning of an upward correction.
5M Chart of the EUR/USD Pair
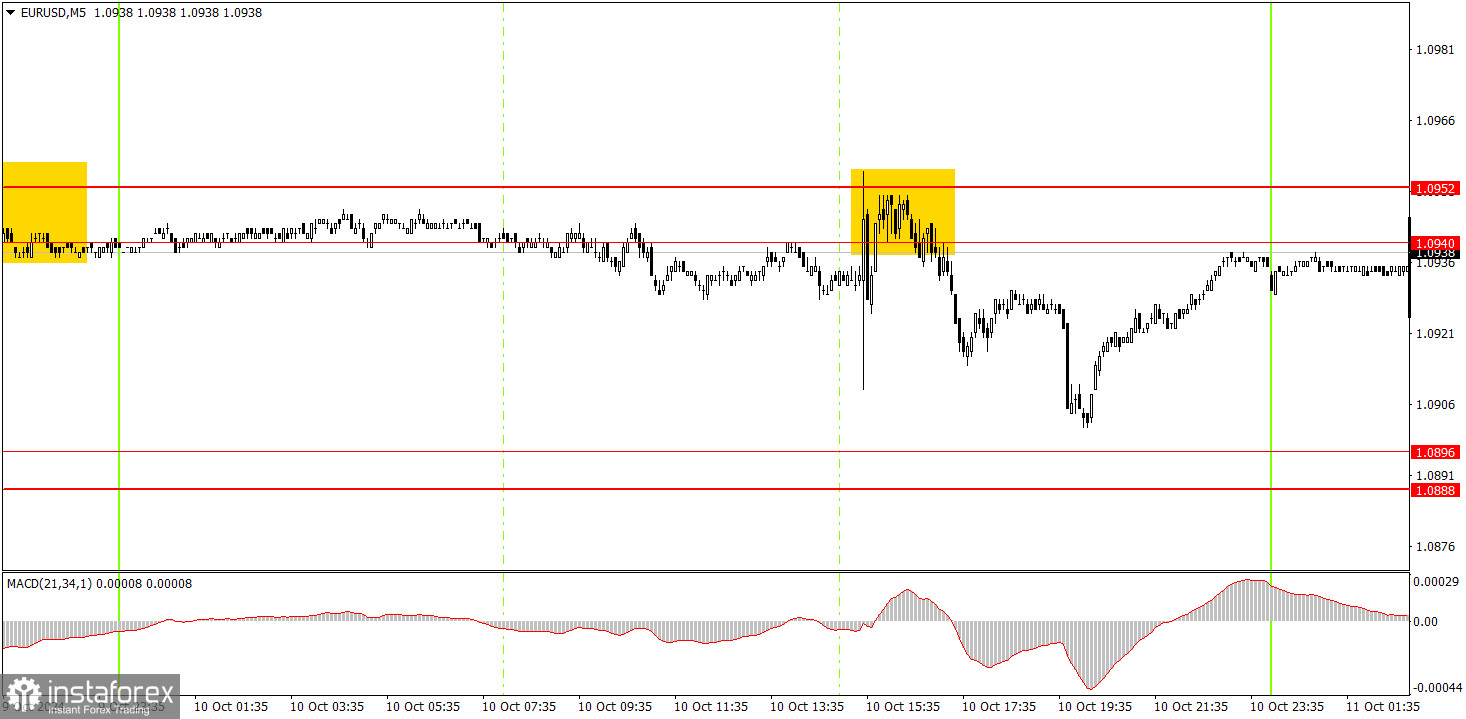
On the 5-minute timeframe on Thursday, a signal formed in the 1.0940-1.0952 level, but there were significant doubts about whether it was worth trading. It emerged after the release of the U.S. inflation report, when movement in any direction could have been expected. Therefore, if someone acted on this signal, fine; if not, it is not a big deal, as it could have been disregarded. During the European session, the pair also rebounded from the specified area, but this trade should have been closed before the U.S. report was released. Alternatively, a stop-loss could have been set for this trade.
How to Trade on Friday: On the hourly timeframe, the EUR/USD pair made significant progress towards a new downward trend last week. Unfortunately, similar selling pressure on the dollar could resume in the medium term, as no one knows how long the market will continue to react to the Federal Reserve's monetary policy easing. However, at the moment a downward trend is evident on the hourly timeframe. After an upward correction (or even without one), further decline in the euro can be expected, as it remains highly overbought.
On Friday, trading can continue from the 1.0940-1.0951 level, as the price has returned to it.
On the 5-minute timeframe, consider the levels of 1.0726-1.0733, 1.0797-1.0804, 1.0838-1.0856, 1.0888-1.0896, 1.0940-1.0951, 1.1011, 1.1048, 1.1091, 1.1132-1.1140, 1.1189-1.1191, 1.1275-1.1292. On Friday, no significant events or publications are scheduled in the Eurozone, but two reports will be released in the U.S. that could trigger a reaction—the Producer Price Index and the University of Michigan Consumer Sentiment Index.
Main Rules of the Trading System:
What the Charts Show:
Support and resistance levels—these are target levels when opening buy or sell trades. Near these levels, you can place Take Profit levels.
Red lines—channels or trend lines that display the current trend and indicate the preferred trading direction.
MACD indicator (14,22,3)—histogram and signal line—an auxiliary indicator that can also be used as a signal source.
Important speeches and reports (always listed in the economic calendar) can greatly influence the movement of a currency pair. Therefore, during their release, trading should be done with extreme caution or positions should be closed to avoid sudden price reversals against the prior movement.
Beginners trading in the forex market should remember that not every trade can be profitable. Developing a clear strategy and employing money management are the keys to success in trading over the long term.
Le recensioni analitiche di InstaForex ti renderanno pienamente consapevole delle tendenze del mercato! Essendo un cliente InstaForex, ti viene fornito un gran numero di servizi gratuiti per il trading efficiente.

