 Rimani
Condizioni di trading
Strumenti


Monday trade analysis:
1H chart of the EUR/USD pair:
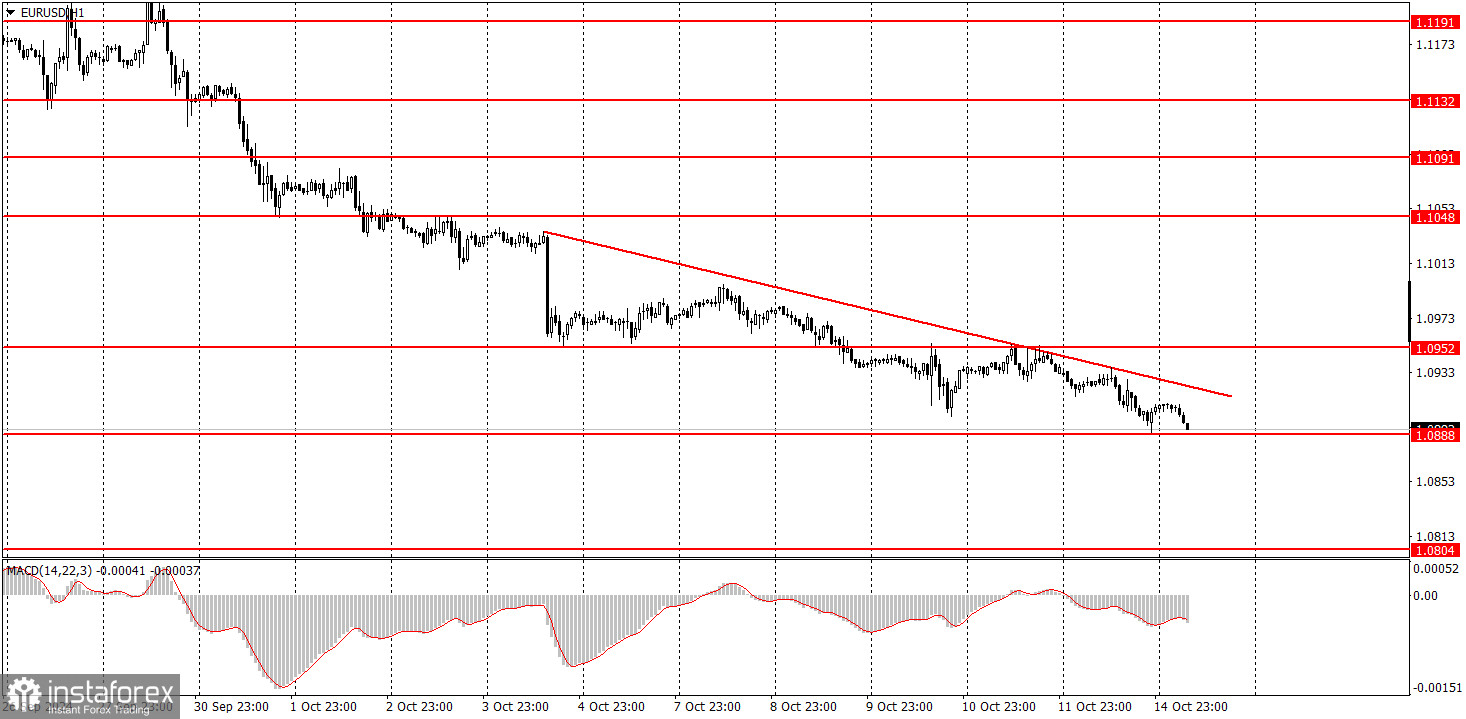
On Monday, the EUR/USD pair continued to fall. The decline persisted into Tuesday night, despite no reports being released in the EU or the US on Monday and no significant events in these countries. However, the euro continues to slide down daily. The decline is gradual, with low volatility, but the euro continues its steady downward movement. This movement doesn't surprise us, as we have long pointed out that the euro was overbought and unjustifiably expensive. Therefore, the euro's near-daily decline seems logical to us. The market had already priced in the entire Federal Reserve's monetary policy easing cycle, and now that this cycle has begun, there is no longer any reason to sell the dollar. Additionally, the market seems to have completely forgotten that the ECB is also cutting rates and may do so for the third time this week. From our perspective, the pair should continue to decline in the medium term.
5M chart of the EUR/USD pair:
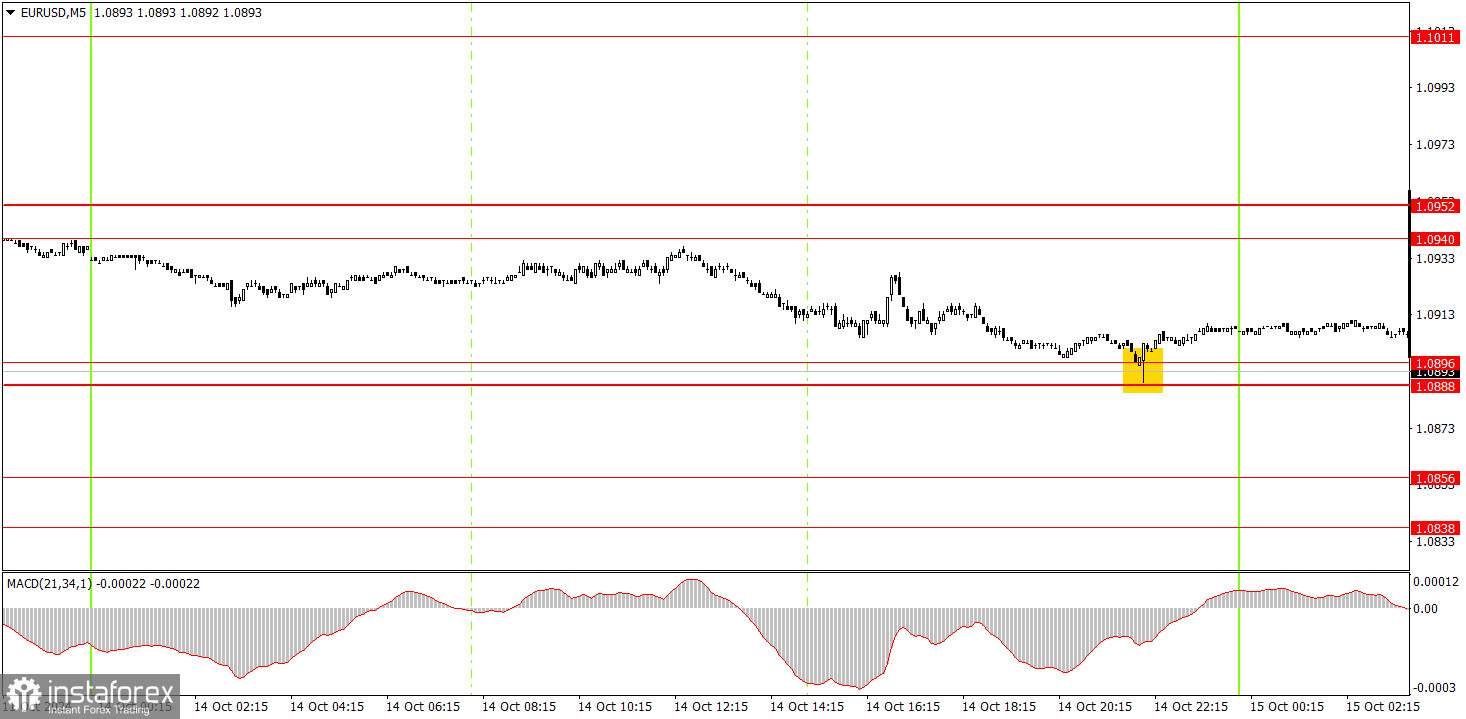
On the 5-minute timeframe, the pair generated a buy signal late in the evening on Monday, which was of no interest. On Friday, the price tested the 1.0940–1.0951 level twice, but it failed to do so on Monday, and therefore there were no sell signals. We are also not very interested in buy signals during the pair's daily declines. There is little justification for buying when the majority is selling.
How to trade on Tuesday:
In the hourly timeframe, the EUR/USD pair has made a significant step towards establishing a new downward trend. Unfortunately, unexpected selling of the dollar could resume in the medium term, as nobody knows how long the market will continue to react to the Fed's monetary policy easing. However, for now, there is a downward trend on the hourly chart. We expect the euro to continue declining, even without a correction, as it remains highly overbought. However, a correction would be more aesthetically pleasing.
On Tuesday, trading could be conducted from the 1.0888–1.0896 level. Movements are likely to be weak again, so high profits are not expected.
On the 5-minute timeframe, the key levels to consider are 1.0726–1.0733, 1.0797–1.0804, 1.0838–1.0856, 1.0888–1.0896, 1.0940–1.0951, 1.1011, 1.1048, 1.1091, 1.1132–1.1140, 1.1189–1.1191. On Tuesday, the only report to be published is the EU industrial production report, which is unlikely to significantly impact the market's desire to trade actively.
Main rules of the trading system:
What's on the charts:
Important speeches and reports (always included in the news calendar) can greatly impact the movement of a currency pair. Therefore, it's essential to trade cautiously or exit the market during their release to avoid a sharp price reversal against the preceding movement.
For beginners trading on the forex market, it is important to remember that not every trade can be profitable. Developing a clear strategy and practicing money management are key to success in trading over the long term.
Le recensioni analitiche di InstaForex ti renderanno pienamente consapevole delle tendenze del mercato! Essendo un cliente InstaForex, ti viene fornito un gran numero di servizi gratuiti per il trading efficiente.


