 Rimani
Condizioni di trading
Strumenti


Monday trade analysis:
1H chart of the GBP/USD pair:
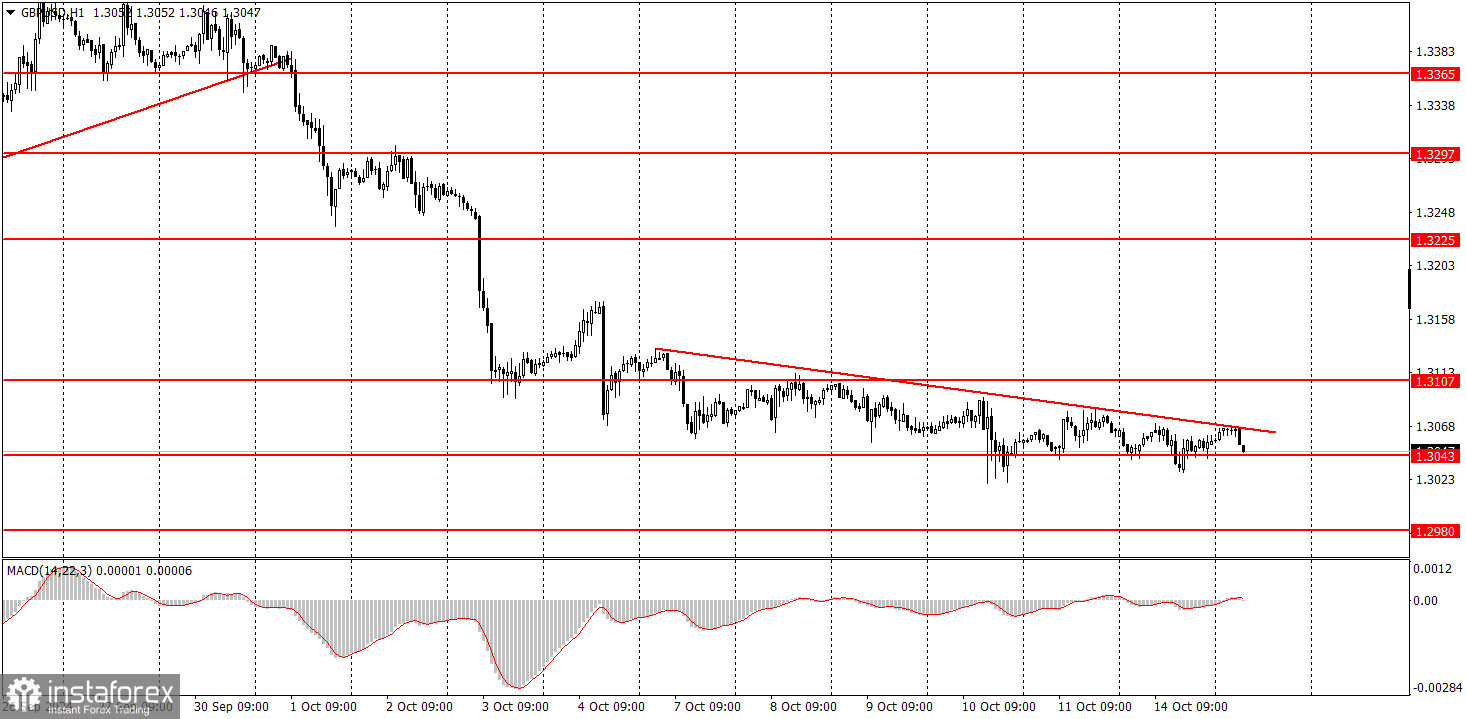
The GBP/USD pair moved towards a decline on Monday, but essentially, we are witnessing a completely flat market. Yes, the price is slowly moving downwards, but volatility is minimal, and the movement is very erratic. Therefore, trading this movement intraday is extremely difficult and perhaps not even worthwhile. Nevertheless, the British pound continues to fall, although, for example, there were no macroeconomic publications or fundamental events yesterday. Even if the price breaks above the conditional trendline, it won't mean much. Everyone has been expecting a correction for two weeks now. However, breaking the trendline in an almost flat movement won't mean that the pound will correct by 100–200 points. In the medium term, we still expect the pair to continue falling. Keep in mind the UK inflation report this week.
5M chart of the GBP/USD pair:
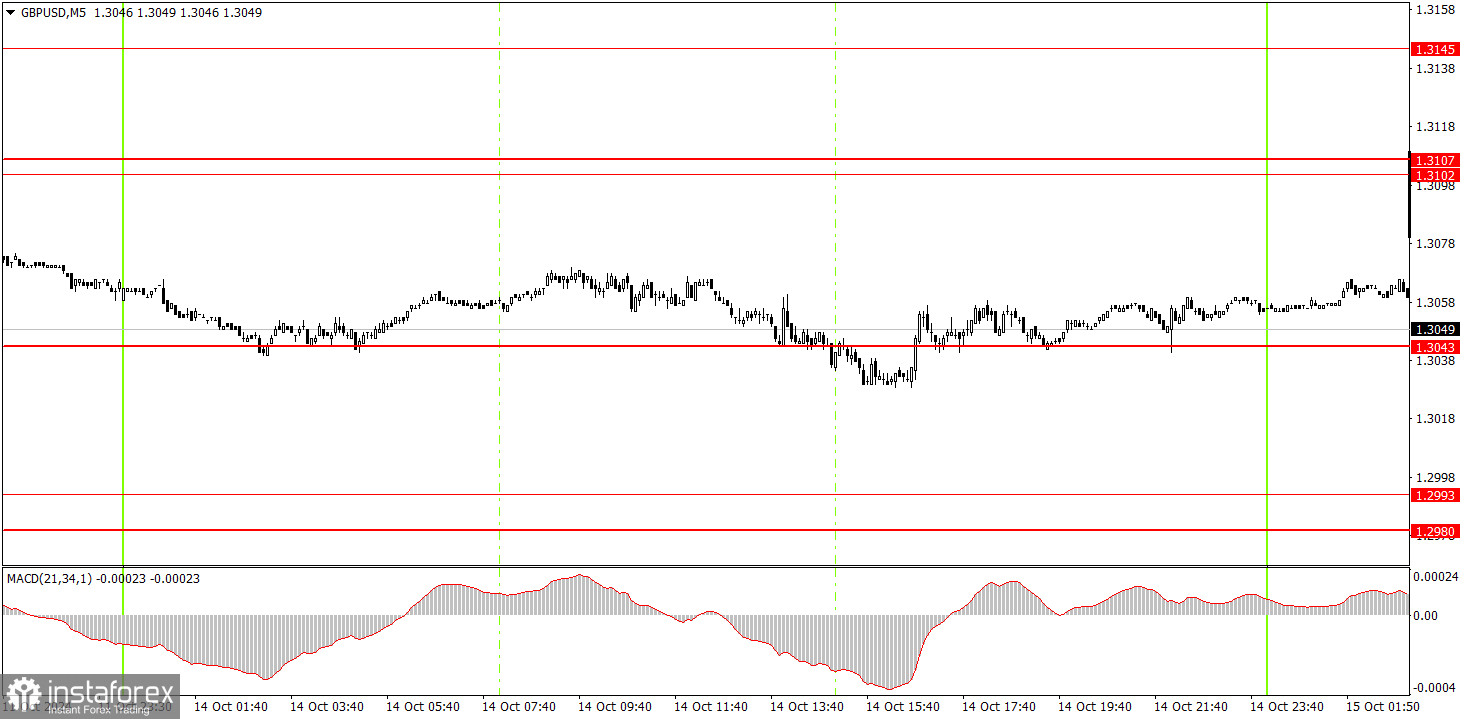
On the 5-minute timeframe, several trade signals were formed on Monday, but there was no reason to act on them. The 5-minute chart clearly shows that the price was moving sideways throughout the day. In a flat market, levels, trendlines, and other technical signals/indicators do not work.
How to trade on Tuesday:
In the hourly timeframe, the GBP/USD pair has broken the upward trend and continues to fall. The US dollar has resumed its upward trend, but caution is advised when selling, as the pair hasn't even attempted a correction in the past two weeks. Nevertheless, there are currently no real grounds to expect a correction. In the medium term, we expect the pair to continue declining, as we believe it's the only logical option.
On Tuesday, nothing but flat movement is expected again. We remind beginner traders that breaking through trendlines or levels during a flat market results in extremely weak signals. And currently, we are also experiencing very low volatility.
On the 5-minute timeframe, you can trade from levels 1.2913, 1.2980-1.2993, 1.3043, 1.3102-1.3107, 1.3145-1.3167, 1.3225, 1.3272, 1.3365, 1.3428-1.3440, 1.3488, and 1.3537. On Tuesday, the UK will publish wage and unemployment reports. These are somewhat interesting reports, but the weak downward trend will likely persist, along with low volatility. On Wednesday, the UK inflation report could shake up the market a bit.
Main rules of the trading system:
What's on the charts:
Important speeches and reports (always included in the news calendar) can greatly influence the movement of a currency pair. Therefore, during their release, it's recommended to trade with maximum caution or exit the market to avoid sharp price reversals against the preceding movement.
For beginners trading on the forex market, it is important to remember that not every trade can be profitable. Developing a clear strategy and practicing money management are key to long-term success in trading.
Le recensioni analitiche di InstaForex ti renderanno pienamente consapevole delle tendenze del mercato! Essendo un cliente InstaForex, ti viene fornito un gran numero di servizi gratuiti per il trading efficiente.


