 Rimani
Condizioni di trading
Strumenti


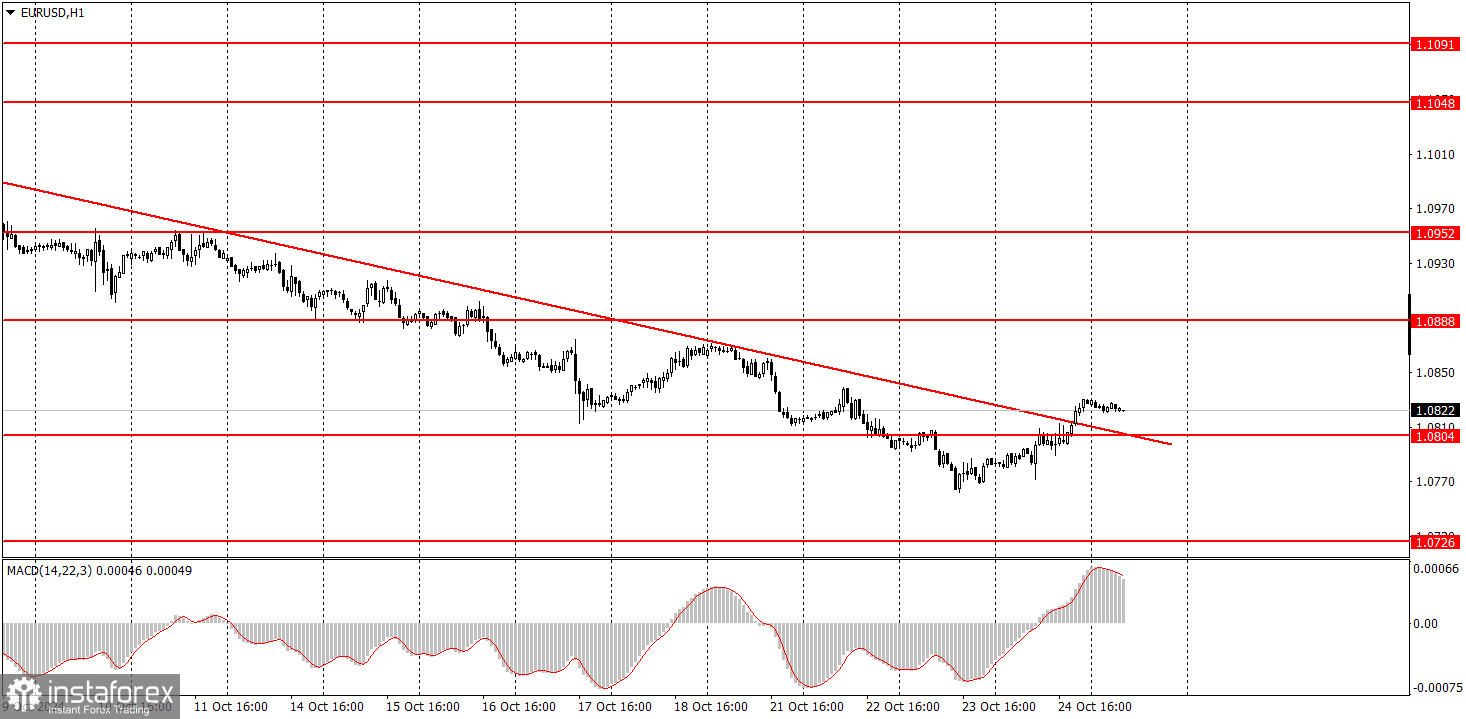
The EUR/USD currency pair showed minimal growth on Thursday, but it was enough for the price to break above the descending trendline for the first time in a long while, offering a chance for some upward movement. We want to warn novice traders that this trendline breakout could be false. Of course, the euro cannot decline indefinitely, but after a month-long fall, it is hard to believe that the pair could start rising easily and quickly. For example, there were no macroeconomic reasons for the euro's growth yesterday. The business activity indices in the Eurozone were mixed, while those in the U.S. exceeded forecasts. Only in Germany did the indices surpass market expectations, which could have contributed to strengthening the euro. But in that case, the nature of the euro's rise is purely news-driven. Will there be news today to support the euro? Not necessarily.
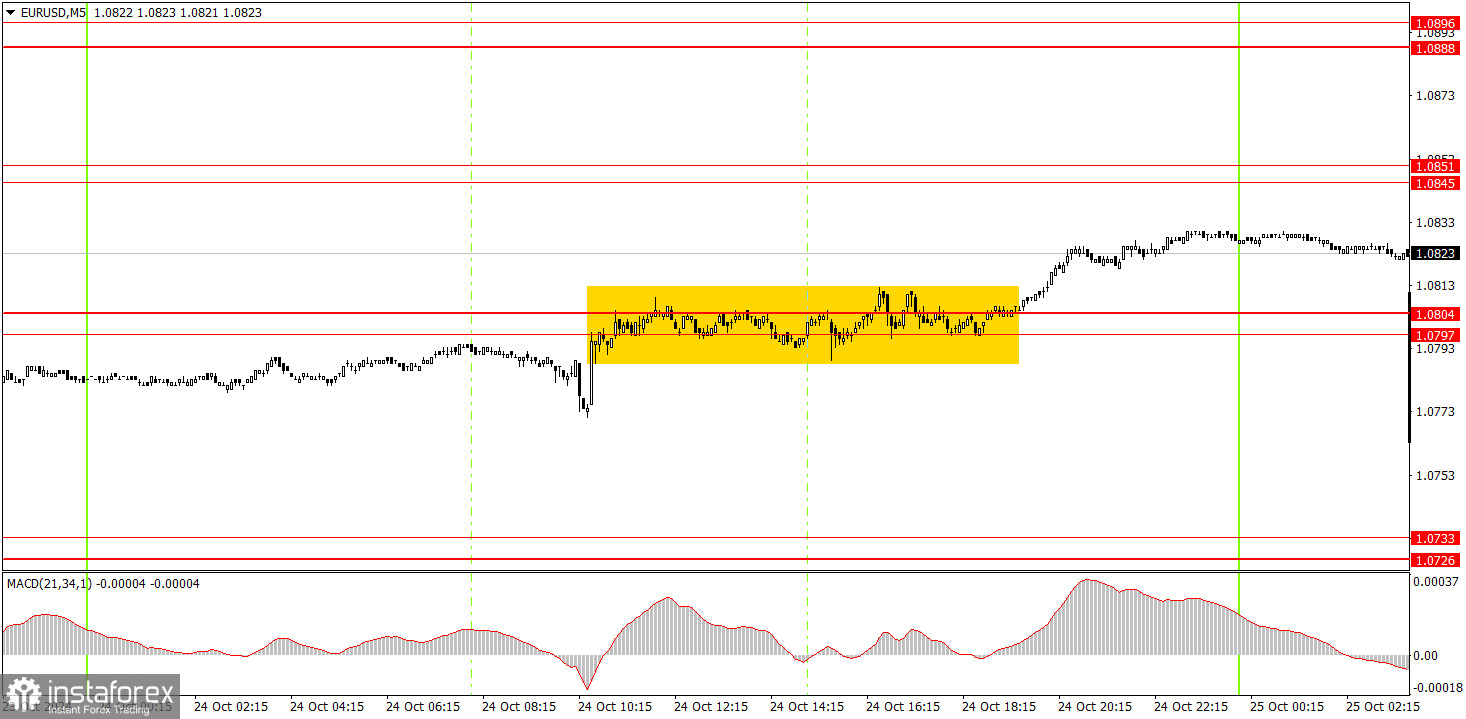
Exactly one trading signal was formed in the 5-minute time frame on Thursday. During the European trading session, the price reached the area of 1.0797-1.0804 and couldn't move either below or above it for six hours. However, it eventually broke above this area, which could have served as a signal for long positions. The trade could have been left open into Friday since the signal formed quite late in the day.
In the hourly time frame, the EUR/USD pair might start to correct after a month-long decline. At the very least, some grounds exist for the euro's potential rise. We believe the pair might correct, but the correction is unlikely to be strong. In the medium term, we still expect further declines.
On Friday, novice traders may maintain long positions opened based on yesterday's buy signal. Let's say—the likelihood that the euro will start rising easily and quickly is low, but yesterday, we received the first buy signal in a long time, and the pair had been declining for a whole month.
In the 5-minute time frame, traders should monitor the levels of 1.0678, 1.0726-1.0733, 1.0797-1.0804, 1.0845-1.0851, 1.0888-1.0896, 1.0940-1.0951, 1.1011, 1.1048, 1.1091, 1.1132-1.1140. No significant events are scheduled for Friday in the Eurozone, while in the U.S., two important reports will be released—on durable goods orders and consumer sentiment from the University of Michigan.
Support and Resistance Price Levels: These levels serve as targets when opening buy or sell positions. They can also be used as points to set Take Profit levels.
Red Lines: These represent channels or trend lines that display the current trend and indicate the preferred trading direction.
MACD Indicator (14,22,3): The histogram and signal line serve as a supplementary indicator that can also be used as a source of trading signals.
Important Speeches and Reports (always found in the news calendar) can significantly impact the movement of a currency pair. Therefore, trading should be done with maximum caution during their release, or you may choose to exit the market to avoid a sharp price reversal against the preceding movement.
For Beginners Trading on the Forex Market: It's essential to remember that not every trade will be profitable. Developing a clear strategy and practicing money management is key to achieving long-term success in trading.
Le recensioni analitiche di InstaForex ti renderanno pienamente consapevole delle tendenze del mercato! Essendo un cliente InstaForex, ti viene fornito un gran numero di servizi gratuiti per il trading efficiente.


