 Rimani
Condizioni di trading
Strumenti


The EUR/USD currency pair fell on Thursday after the results of the Federal Reserve meeting were announced. At last, we've seen some strengthening of the U.S. dollar, and finally, the market reacted somewhat logically. Let's recall that the FOMC meeting could be considered hawkish. In recent weeks, the market has been panicking, dumping the dollar while pricing everything at once—a U.S. recession, aggressive Fed rate cuts, hyperinflation, and more. However, Jerome Powell and the FOMC clarified that there is no reason for concern: the U.S. economy is stable, the labor market is strong, the Fed expects only two rate cuts in 2025, and reducing inflation remains the central priority. Yes, GDP forecasts were lowered, but inflation forecasts were raised—and higher inflation implies rates will stay elevated longer or be reduced more slowly.
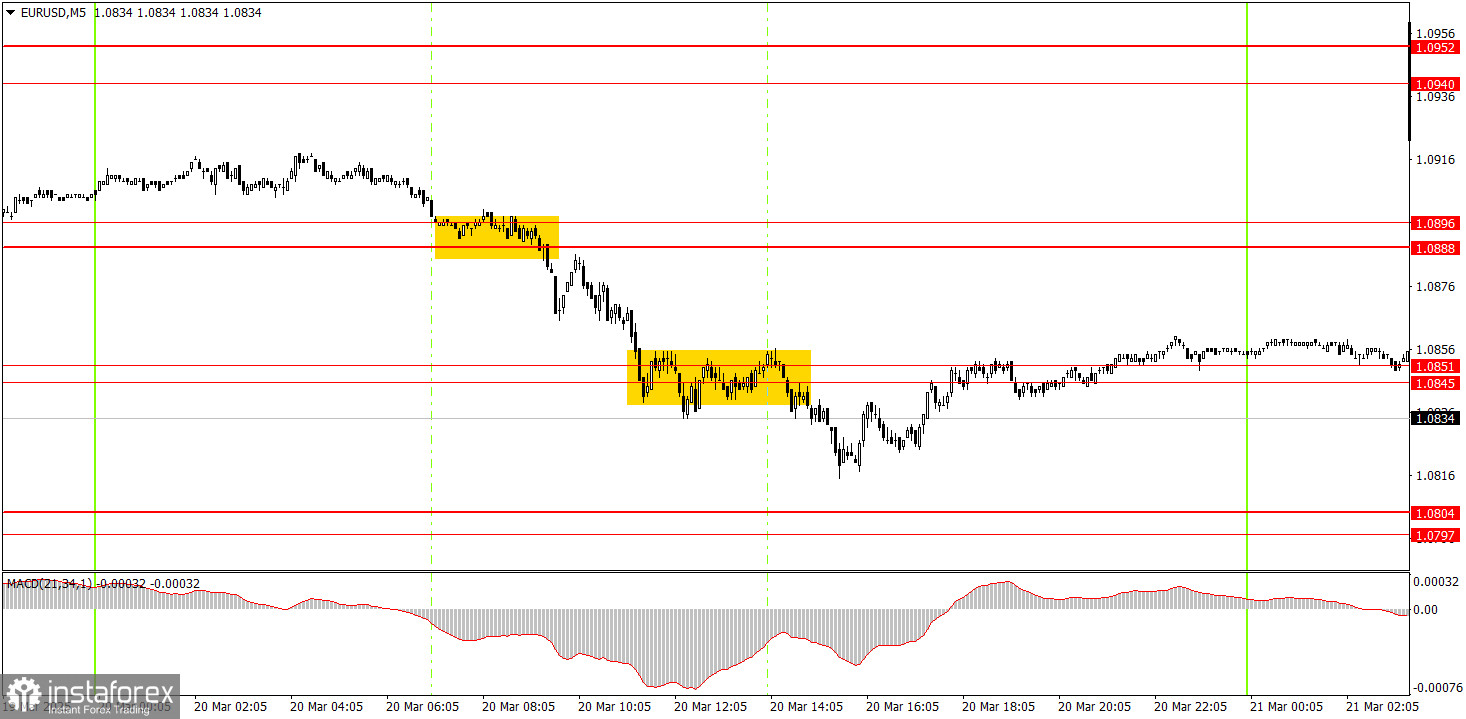
On Thursday, two decent trade signals formed in the 5-minute timeframe. First, the pair broke through the 1.0888–1.0896 zone and later through the 1.0845–1.0851 zone. Unfortunately, the bears failed to reach the 1.0797–1.0804 zone, so the price retreated to the second zone, where novice traders could close short positions. The profit amounted to around 30 pips.
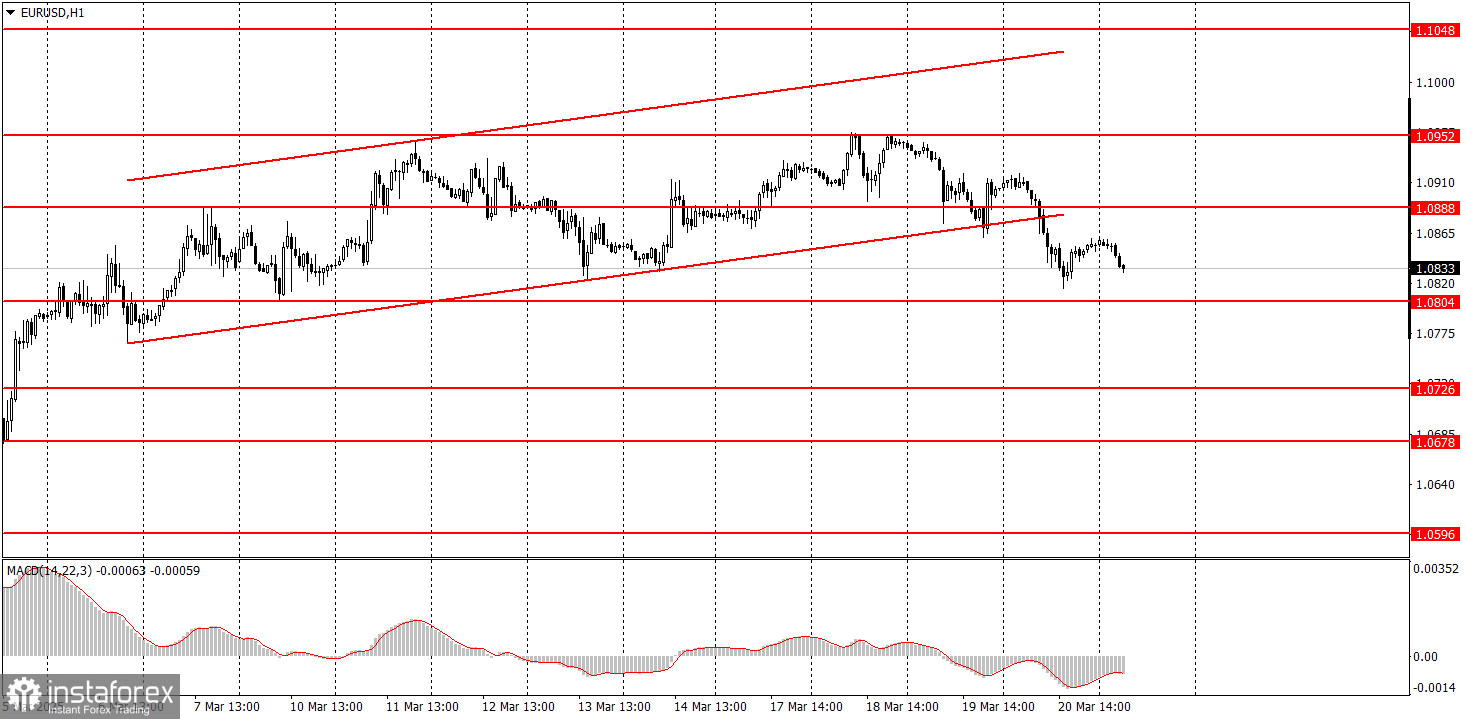
On the hourly chart, EUR/USD continues to follow a medium-term downtrend, although the chances of a full resumption are fading. Since the fundamental and macroeconomic backdrop still supports the U.S. dollar much more than the euro, we continue to expect a decline. However, Donald Trump keeps pushing the dollar into the abyss with his frequent tariff decisions and statements about global order. As a result, fundamentals and macro data are overshadowed by politics and geopolitics, leading to persistent dollar weakness.
On Friday, the euro may continue to decline, as for the first time in a while, the market has responded to fundamentals appropriately. From a technical perspective, the pair broke out of the ascending channel. The dollar is oversold and undervalued without justification—a correction is at least reasonable.
On the 5-minute chart, consider trading around the levels: 1.0433–1.0451, 1.0526, 1.0596, 1.0678, 1.0726–1.0733, 1.0797–1.0804, 1.0845–1.0851, 1.0888–1.0896, 1.0940–1.0952, 1.1011, 1.1048. No major events are expected in the U.S. or Eurozone on Friday, which may lead to low volatility; however, the euro could still experience a slight decline.
Support and Resistance Levels: These are target levels for opening or closing positions and can also serve as points for placing Take Profit orders.
Red Lines: Channels or trendlines indicating the current trend and the preferred direction for trading.
MACD Indicator (14,22,3): A histogram and signal line used as a supplementary source of trading signals.
Important Events and Reports: Found in the economic calendar, these can heavily influence price movements. Exercise caution or exit the market during their release to avoid sharp reversals.
Forex trading beginners should remember that not every trade will be profitable. Developing a clear strategy and practicing proper money management are essential for long-term trading success.
Le recensioni analitiche di InstaForex ti renderanno pienamente consapevole delle tendenze del mercato! Essendo un cliente InstaForex, ti viene fornito un gran numero di servizi gratuiti per il trading efficiente.


