 Rimani
Condizioni di trading
Strumenti


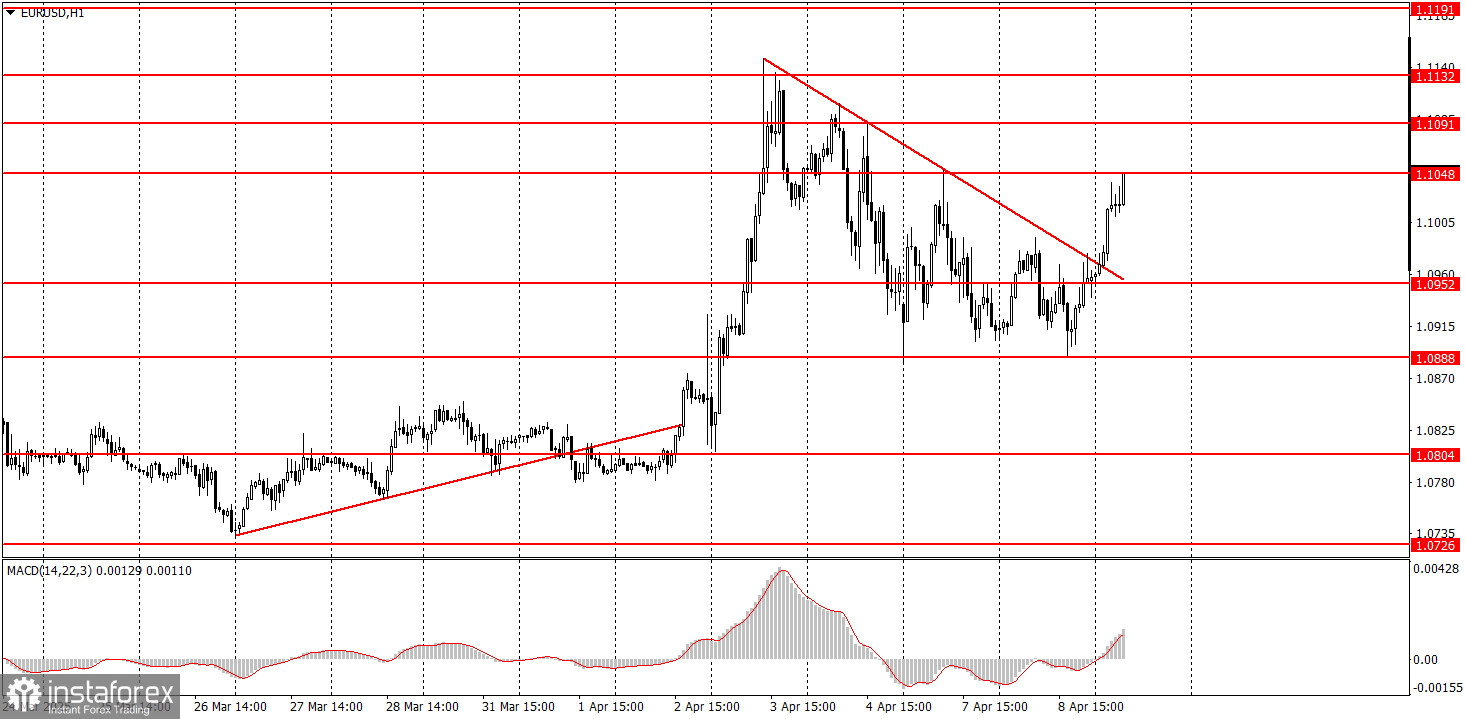
On Tuesday, the EUR/USD currency pair traded with low volatility throughout the day, mostly moving sideways. However, as we warned, this was merely the calm before the storm. There were no important macroeconomic events in the Eurozone or the U.S., but Donald Trump decided to raise trade tariffs on China by another 50%, as Beijing responded to the initial set of tariffs. All imports from China will be subject to the "Trump tax" of a modest 104%. The madness continued, and the dollar immediately resumed its decline. In the hourly timeframe, the descending trendline was broken, the pair corrected, and the upward movement may continue. As we had previously noted, any new tariffs from Trump are likely to trigger just one thing – further declines in the dollar and the U.S. stock market.
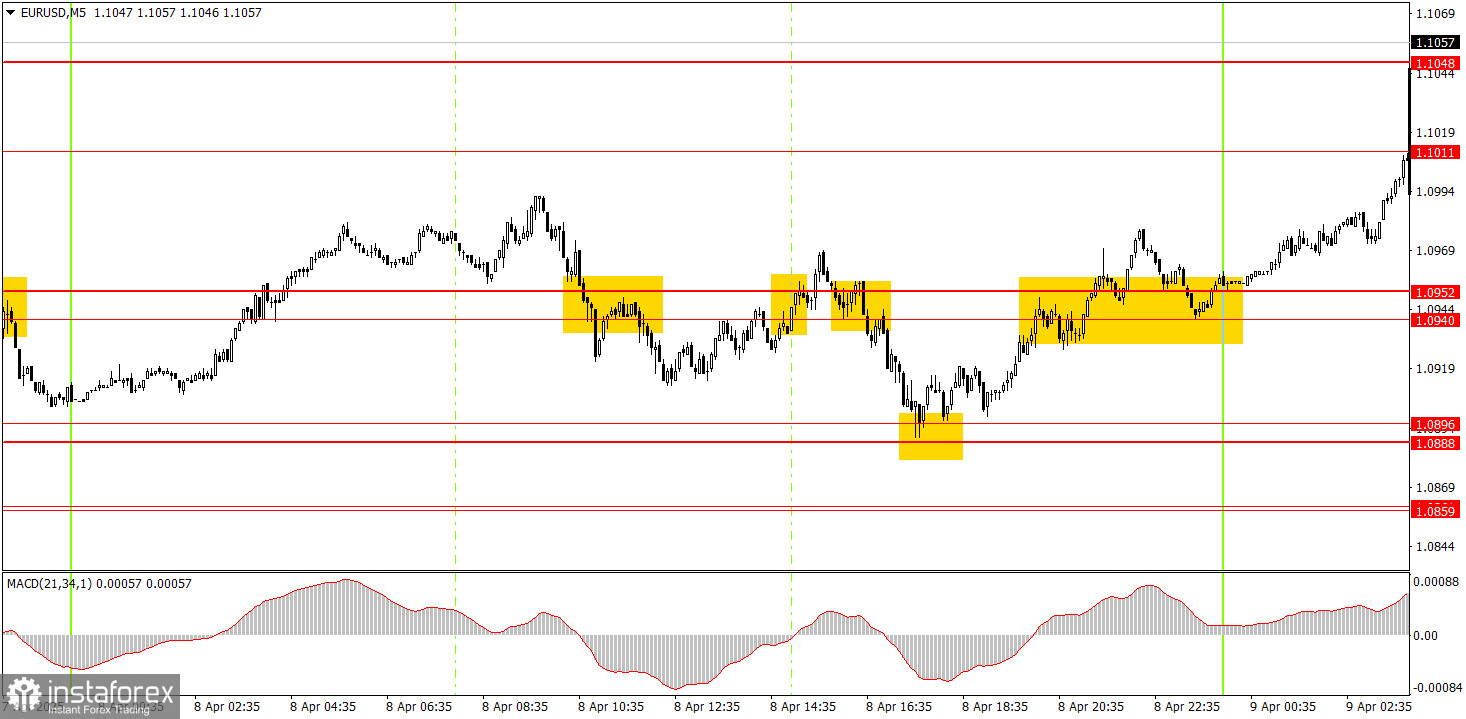
In the 5-minute chart, several trading signals were formed on Tuesday, but the market movements throughout the day were choppy and range-bound. Three signals appeared around the 1.0940–1.0952 area, two of which were false. However, the signal near the 1.0888–1.0896 area generated good profits and allowed for holding long positions longer than usual. The announcement about the new tariffs on China came in the evening, so expecting and preparing for another dollar sell-off was justified. As of now, this trade has yielded 155 pips in profit.
On the hourly timeframe, EUR/USD continues its upward trend. How long it will last is unknown, as no one knows how many more trade tariffs Trump will introduce. A further trade war escalation is highly possible, especially since many countries plan to respond to the U.S. with mirrored measures. Trump has already stated that any countermeasures will lead to new tariffs from the U.S.
On Wednesday, markets are likely to remain in a state of shock. We are not making any predictions about market movements. What's happening across global markets right now is difficult to describe in words.
On the 5-minute chart, consider the following levels for trading: 1.0596, 1.0678, 1.0726–1.0733, 1.0797–1.0804, 1.0859–1.0861, 1.0888–1.0896, 1.0940–1.0952, 1.1011, 1.1048, 1.1091, 1.1132–1.1140, 1.1189–1.1191, 1.1275–1.1292.
There will be no macroeconomic background in the U.S. or the Eurozone on Wednesday – not that it matters now. Not even the Fed Minutes due in the evening are relevant now. Everything still revolves around Trump and his trade policy.
Support and Resistance Levels: These are target levels for opening or closing positions and can also serve as points for placing Take Profit orders.
Red Lines: Channels or trendlines indicating the current trend and the preferred direction for trading.
MACD Indicator (14,22,3): A histogram and signal line used as a supplementary source of trading signals.
Important Events and Reports: Found in the economic calendar, these can heavily influence price movements. Exercise caution or exit the market during their release to avoid sharp reversals.
Forex trading beginners should remember that not every trade will be profitable. Developing a clear strategy and practicing proper money management are essential for long-term trading success.
Le recensioni analitiche di InstaForex ti renderanno pienamente consapevole delle tendenze del mercato! Essendo un cliente InstaForex, ti viene fornito un gran numero di servizi gratuiti per il trading efficiente.


