Queste informazioni sono fornite ai clienti al dettaglio e professionisti come parte della comunicazione di marketing. Non contiene e non deve essere interpretata come contenente consigli di investimento o raccomandazioni di investimento o un'offerta o una sollecitazione a impegnarsi in qualsiasi transazione o strategia in strumenti finanziari. Le performance passate non sono una garanzia o una previsione delle performance future. Instant Trading EU Ltd. non rilascia alcuna dichiarazione e non si assume alcuna responsabilità in merito all'accuratezza o completezza delle informazioni fornite, o qualsiasi perdita derivante da qualsiasi investimento basato su analisi, previsioni o altre informazioni fornite da un dipendente della Società o altri. Il disclaimer completo è disponibile qui.
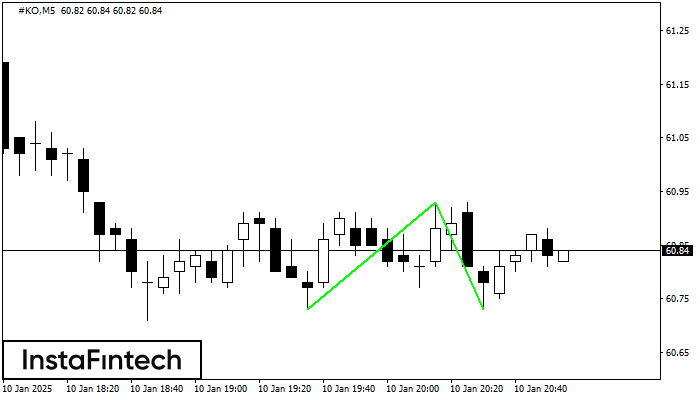
Double Bottom
was formed on 10.01 at 20:55:05 (UTC+0)
signal strength 1 of 5
was formed on 10.01 at 20:55:05 (UTC+0)
signal strength 1 of 5

The Double Bottom pattern has been formed on #KO M5; the upper boundary is 60.93; the lower boundary is 60.73. The width of the pattern is 20 points. In case of a break of the upper boundary 60.93, a change in the trend can be predicted where the width of the pattern will coincide with the distance to a possible take profit level.
The M5 and M15 time frames may have more false entry points.
Figure
Instrument
Timeframe
Trend
Signal Strength

 Rimani


