
 Rimani


I pattern sono modelli grafici che forma il prezzo nel grafico. Secondo uno dei postulati dell'analisi tecnica, la storia (movimento dei prezzi) si ripete. Ciò significa che i movimenti dei prezzi sono spesso simili nelle stesse situazioni, il che rende possibile prevedere con maggiore probabilità ulteriore sviluppo della situazione.
I pattern pertinenti di InstaForex è un servizio facile da usare che ti consente di conoscere gli ultimi cambiamenti del mercato e reagire agli eventi in tempo. Nel nostro servizio troverai sempre gli schemi più recenti e pertinenti su ogni coppia a qualunque ora.
was formed on 26.03 at 20:35:18 (UTC+0)
signal strength 1 of 5
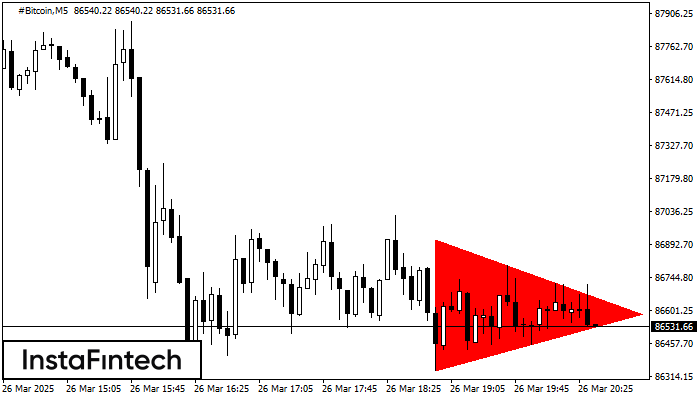
According to the chart of M5, #Bitcoin formed the Bearish Symmetrical Triangle pattern. Trading recommendations: A breach of the lower border 86339.47 is likely to encourage a continuation of the downward trend.
The M5 and M15 time frames may have more false entry points.
Guardate inoltre
- All
- Double Top
- Flag
- Head and Shoulders
- Pennant
- Rectangle
- Triangle
- Triple top
- All
- #AAPL
- #AMZN
- #EBAY
- #FB
- #GOOG
- #INTC
- #KO
- #MA
- #MCD
- #MSFT
- #NTDOY
- #PEP
- #TSLA
- #TWTR
- AUDCAD
- AUDCHF
- AUDJPY
- AUDUSD
- EURCAD
- EURCHF
- EURGBP
- EURJPY
- EURNZD
- EURRUB
- EURUSD
- GBPAUD
- GBPCHF
- GBPJPY
- GBPUSD
- GOLD
- NZDCAD
- NZDCHF
- NZDJPY
- NZDUSD
- SILVER
- USDCAD
- USDCHF
- USDJPY
- USDRUB
- All
- M5
- M15
- M30
- H1
- D1
- All
- Buy
- Sale
- All
- 1
- 2
- 3
- 4
- 5

Secondo il grafico di M15, #Bitcoin ha formato il modello Triangolo Simmetrico Rialzista. Descrizione: Questo è il modello di una continuazione di trend. 87754.54 e 86429.29 sono rispettivamente le coordinate
I time frame M5 e M15 possono avere più punti di ingresso falsi.
Open chart in a new window
Il modello Doppio Minimo è stato formato su GBPCHF M30. Questa formazione segnala un'inversione del trend dal discendente all'ascendente. Il segnale è che una posizione buy dovrebbe essere aperta dopo
Open chart in a new window
Secondo il grafico di M5, EURUSD ha formato il modello Triangolo Simmetrico Rialzista. Il confine inferiore del modello tocca le coordinate 1.1501/1.1531 mentre il confine superiore attraversa 1.1573/1.1531
I time frame M5 e M15 possono avere più punti di ingresso falsi.
Open chart in a new window


