
 Rimani

I pattern sono modelli grafici che forma il prezzo nel grafico. Secondo uno dei postulati dell'analisi tecnica, la storia (movimento dei prezzi) si ripete. Ciò significa che i movimenti dei prezzi sono spesso simili nelle stesse situazioni, il che rende possibile prevedere con maggiore probabilità ulteriore sviluppo della situazione.
I pattern pertinenti di InstaForex è un servizio facile da usare che ti consente di conoscere gli ultimi cambiamenti del mercato e reagire agli eventi in tempo. Nel nostro servizio troverai sempre gli schemi più recenti e pertinenti su ogni coppia a qualunque ora.
was formed on 27.03 at 21:30:21 (UTC+0)
signal strength 2 of 5
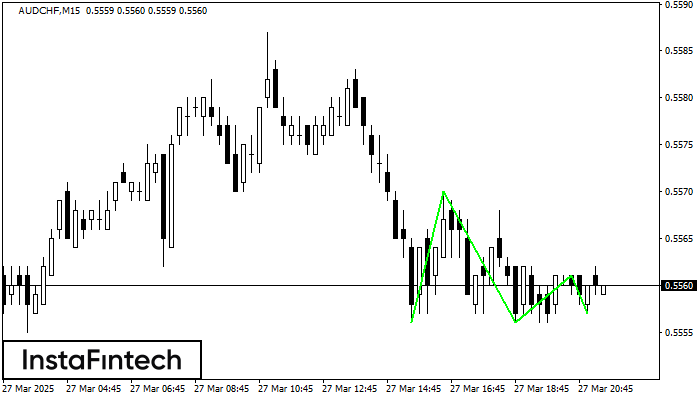
The Triple Bottom pattern has formed on the chart of AUDCHF M15. Features of the pattern: The lower line of the pattern has coordinates 0.5570 with the upper limit 0.5570/0.5561, the projection of the width is 14 points. The formation of the Triple Bottom pattern most likely indicates a change in the trend from downward to upward. This means that in the event of a breakdown of the resistance level 0.5556, the price is most likely to continue the upward movement.
The M5 and M15 time frames may have more false entry points.
Guardate inoltre
- All
- Double Top
- Flag
- Head and Shoulders
- Pennant
- Rectangle
- Triangle
- Triple top
- All
- #AAPL
- #AMZN
- #EBAY
- #FB
- #GOOG
- #INTC
- #KO
- #MA
- #MCD
- #MSFT
- #NTDOY
- #PEP
- #TSLA
- #TWTR
- AUDCAD
- AUDCHF
- AUDJPY
- AUDUSD
- EURCAD
- EURCHF
- EURGBP
- EURJPY
- EURNZD
- EURRUB
- EURUSD
- GBPAUD
- GBPCHF
- GBPJPY
- GBPUSD
- GOLD
- NZDCAD
- NZDCHF
- NZDJPY
- NZDUSD
- SILVER
- USDCAD
- USDCHF
- USDJPY
- USDRUB
- All
- M5
- M15
- M30
- H1
- D1
- All
- Buy
- Sale
- All
- 1
- 2
- 3
- 4
- 5
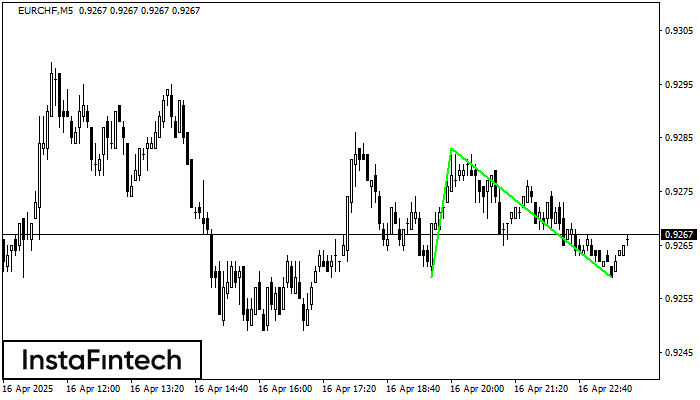
Vzor Dvojité dno se vytvořil na grafu M5 u nástroje EURCHF; horní hranice je 0.9283; spodní hranice je 0.9259. Šířka vzoru je 24 bodů. V případě průlomu horní hranice 0.9283
Časové rámce M5 a M15 mohou mít více falešných vstupních bodů.
Open chart in a new window
Na grafu H1 u nástroje #KO se vytvořil obratový vzor Dvojitý vrchol. Charakteristika: horní hranice 72.67; spodní hranice 71.72; šířka vzoru činí 95 bodů. Signál: průlom spodní hranice způsobí pokračování
Open chart in a new window
Na grafu H1 se u obchodního nástroje #MA vytvořil vzor Trojitý vrchol, který naznačuje změnu trendu. Je možné, že po vytvoření třetího vrcholu se cena pokusí prolomit úroveň rezistence 508.17
Open chart in a new window


