was formed on 28.03 at 01:00:48 (UTC+0)
signal strength 3 of 5

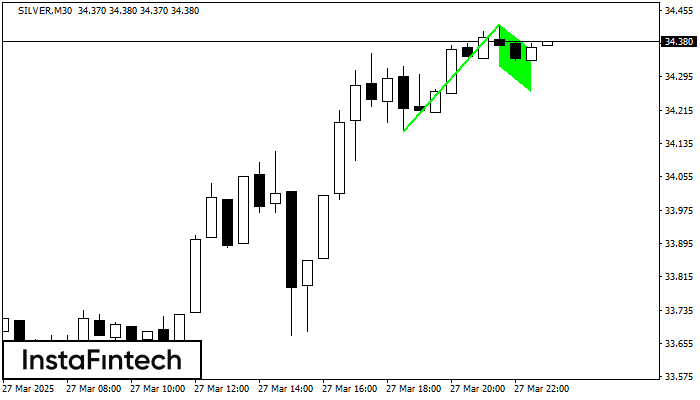
The Bullish Flag pattern has been formed on SILVER at M30. The lower boundary of the pattern is located at 34.32/34.26, while the higher boundary lies at 34.42/34.36. The projection of the flagpole is 255 points. This formation signals that the upward trend is most likely to continue. Therefore, if the level of 34.42 is broken, the price will move further upwards.
Guardate inoltre
- All
- Double Top
- Flag
- Head and Shoulders
- Pennant
- Rectangle
- Triangle
- Triple top
- All
- #AAPL
- #AMZN
- #EBAY
- #FB
- #GOOG
- #INTC
- #KO
- #MA
- #MCD
- #MSFT
- #NTDOY
- #PEP
- #TSLA
- #TWTR
- AUDCAD
- AUDCHF
- AUDJPY
- AUDUSD
- EURCAD
- EURCHF
- EURGBP
- EURJPY
- EURNZD
- EURRUB
- EURUSD
- GBPAUD
- GBPCHF
- GBPJPY
- GBPUSD
- GOLD
- NZDCAD
- NZDCHF
- NZDJPY
- NZDUSD
- SILVER
- USDCAD
- USDCHF
- USDJPY
- USDRUB
- All
- M5
- M15
- M30
- H1
- D1
- All
- Buy
- Sale
- All
- 1
- 2
- 3
- 4
- 5
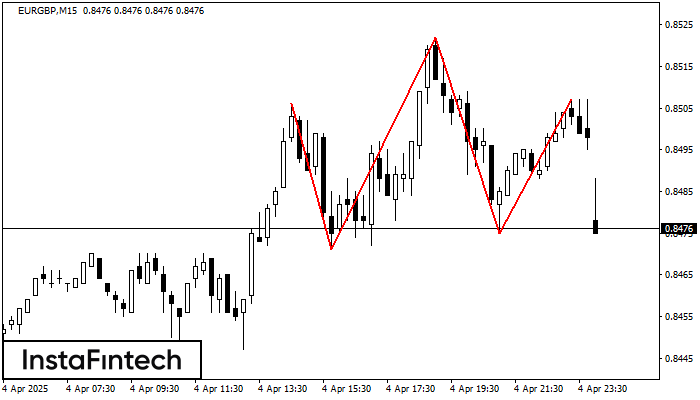
De acordo com o gráfico de M15, EURGBP formou o padrão Cabeça & Ombros. O topo da Cabeça está definido em 0.8522 enquanto a linha mediana do Pescoço é encontrada
Os intervalos M5 e M15 podem ter mais pontos de entrada falsos.
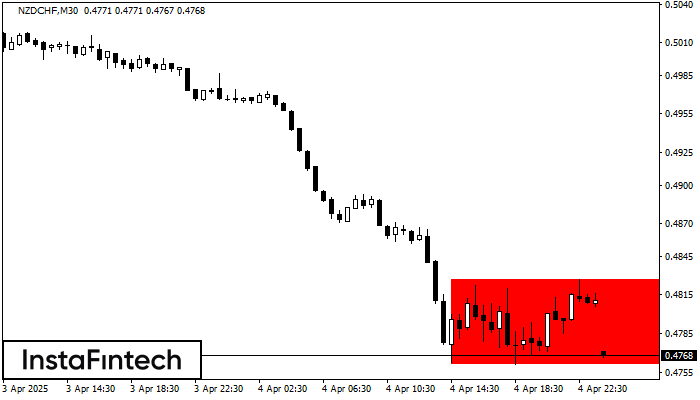
Open chart in a new windowDe acordo com o gráfico de M30, NZDCHF formou Retângulo de baixa. O padrão indica uma continuação da tendência. O limite superior é 0.4827, o limite inferior é 0.4761
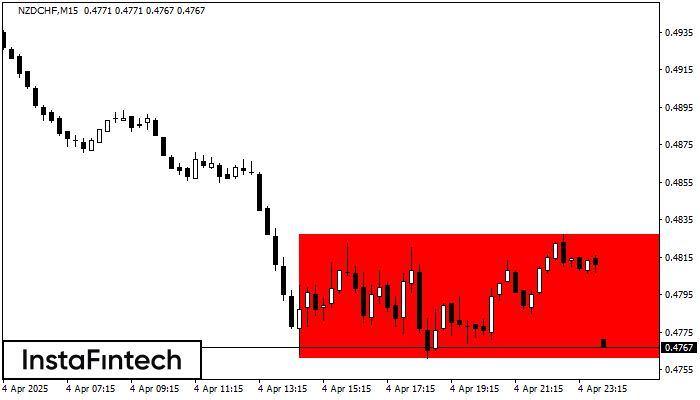
Open chart in a new windowDe acordo com o gráfico de M15, NZDCHF formou Retângulo de baixa. O padrão indica uma continuação da tendência. O limite superior é 0.4827, o limite inferior é 0.4761
Os intervalos M5 e M15 podem ter mais pontos de entrada falsos.
Open chart in a new window
 Rimani


