
 Rimani


I pattern sono modelli grafici che forma il prezzo nel grafico. Secondo uno dei postulati dell'analisi tecnica, la storia (movimento dei prezzi) si ripete. Ciò significa che i movimenti dei prezzi sono spesso simili nelle stesse situazioni, il che rende possibile prevedere con maggiore probabilità ulteriore sviluppo della situazione.
I pattern pertinenti di InstaForex è un servizio facile da usare che ti consente di conoscere gli ultimi cambiamenti del mercato e reagire agli eventi in tempo. Nel nostro servizio troverai sempre gli schemi più recenti e pertinenti su ogni coppia a qualunque ora.
was formed on 28.03 at 21:14:20 (UTC+0)
signal strength 1 of 5
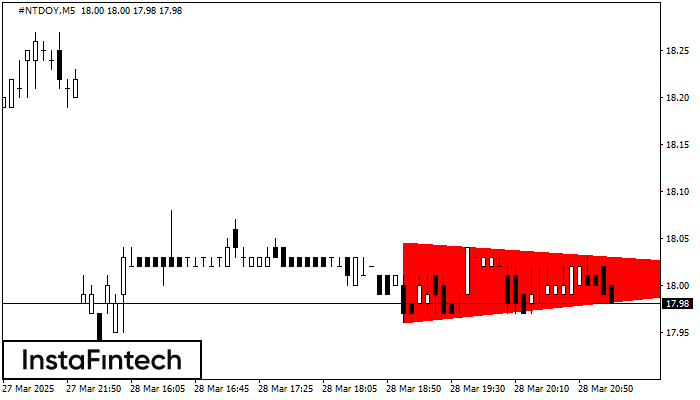
According to the chart of M5, #NTDOY formed the Bearish Symmetrical Triangle pattern. Description: The lower border is 17.96/18.01 and upper border is 18.05/18.01. The pattern width is measured on the chart at -9 pips. The formation of the Bearish Symmetrical Triangle pattern evidently signals a continuation of the downward trend. In other words, if the scenario comes true and #NTDOY breaches the lower border, the price could continue its move toward 17.86.
The M5 and M15 time frames may have more false entry points.
Guardate inoltre
- All
- Double Top
- Flag
- Head and Shoulders
- Pennant
- Rectangle
- Triangle
- Triple top
- All
- #AAPL
- #AMZN
- #EBAY
- #FB
- #GOOG
- #INTC
- #KO
- #MA
- #MCD
- #MSFT
- #NTDOY
- #PEP
- #TSLA
- #TWTR
- AUDCAD
- AUDCHF
- AUDJPY
- AUDUSD
- EURCAD
- EURCHF
- EURGBP
- EURJPY
- EURNZD
- EURRUB
- EURUSD
- GBPAUD
- GBPCHF
- GBPJPY
- GBPUSD
- GOLD
- NZDCAD
- NZDCHF
- NZDJPY
- NZDUSD
- SILVER
- USDCAD
- USDCHF
- USDJPY
- USDRUB
- All
- M5
- M15
- M30
- H1
- D1
- All
- Buy
- Sale
- All
- 1
- 2
- 3
- 4
- 5
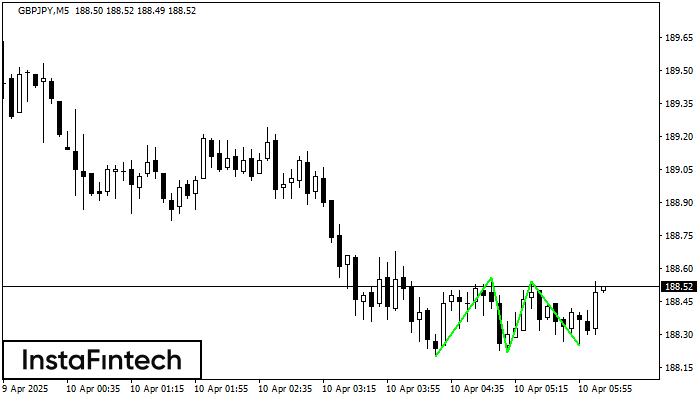
Il modello Triplo Minimo è stato formato su GBPJPY M5. Ha le seguenti caratteristiche: livello di resistenza 188.56/188.54; livello di supporto 188.20/188.25; la larghezza è 36 punti. In caso
I time frame M5 e M15 possono avere più punti di ingresso falsi.
Open chart in a new window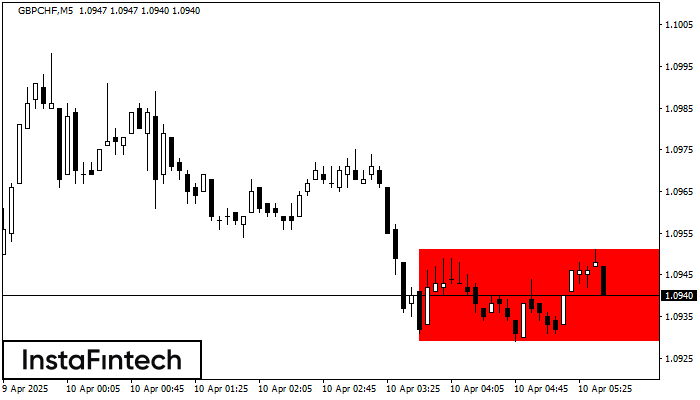
Secondo il grafico di M5, GBPCHF ha formato il Rettangolo Ribassista. Questo tipo di modello indica una continuazione di trend. Consiste di due livelli: resistenza 1.0951 - 0.0000 e supporto
I time frame M5 e M15 possono avere più punti di ingresso falsi.
Open chart in a new window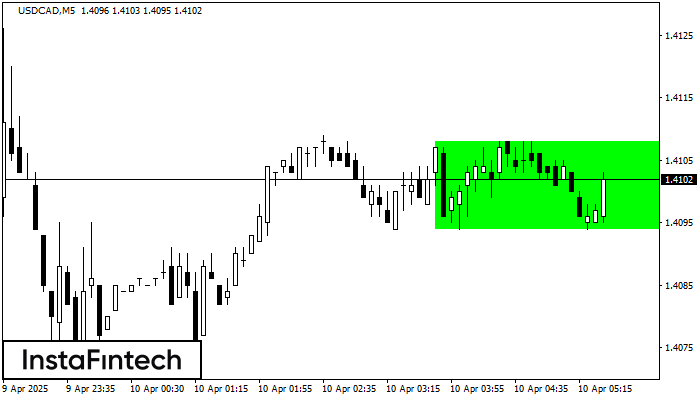
Secondo il grafico di M5, USDCAD ha formato il Rettangolo Rialzista. Il modello indica una continuazione di trend. Il confine superiore è 1.4108, il confine inferiore è 1.4094. Il segnale
I time frame M5 e M15 possono avere più punti di ingresso falsi.
Open chart in a new window


