
 Rimani


I pattern sono modelli grafici che forma il prezzo nel grafico. Secondo uno dei postulati dell'analisi tecnica, la storia (movimento dei prezzi) si ripete. Ciò significa che i movimenti dei prezzi sono spesso simili nelle stesse situazioni, il che rende possibile prevedere con maggiore probabilità ulteriore sviluppo della situazione.
I pattern pertinenti di InstaForex è un servizio facile da usare che ti consente di conoscere gli ultimi cambiamenti del mercato e reagire agli eventi in tempo. Nel nostro servizio troverai sempre gli schemi più recenti e pertinenti su ogni coppia a qualunque ora.
was formed on 28.03 at 23:49:41 (UTC+0)
signal strength 1 of 5
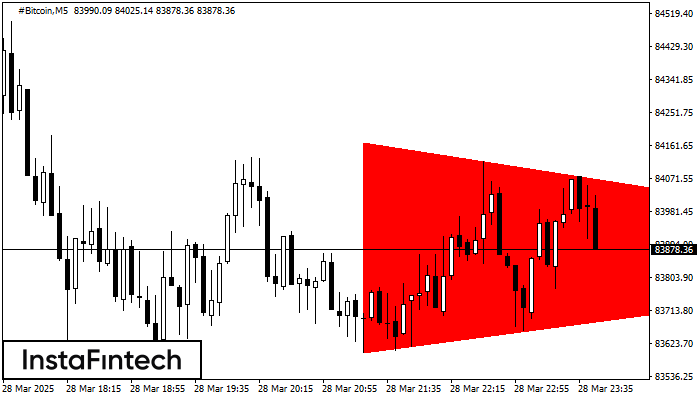
According to the chart of M5, #Bitcoin formed the Bearish Symmetrical Triangle pattern. Trading recommendations: A breach of the lower border 83601.23 is likely to encourage a continuation of the downward trend.
The M5 and M15 time frames may have more false entry points.
Guardate inoltre
- All
- Double Top
- Flag
- Head and Shoulders
- Pennant
- Rectangle
- Triangle
- Triple top
- All
- #AAPL
- #AMZN
- #EBAY
- #FB
- #GOOG
- #INTC
- #KO
- #MA
- #MCD
- #MSFT
- #NTDOY
- #PEP
- #TSLA
- #TWTR
- AUDCAD
- AUDCHF
- AUDJPY
- AUDUSD
- EURCAD
- EURCHF
- EURGBP
- EURJPY
- EURNZD
- EURRUB
- EURUSD
- GBPAUD
- GBPCHF
- GBPJPY
- GBPUSD
- GOLD
- NZDCAD
- NZDCHF
- NZDJPY
- NZDUSD
- SILVER
- USDCAD
- USDCHF
- USDJPY
- USDRUB
- All
- M5
- M15
- M30
- H1
- D1
- All
- Buy
- Sale
- All
- 1
- 2
- 3
- 4
- 5

Il modello Bandiera Ribassista è stato formato sul grafico M15 del AUDJPY che segnala che il trend discendente continuerà. Se il prezzo scende al di sotto del minimo a 90.01
I time frame M5 e M15 possono avere più punti di ingresso falsi.
Open chart in a new window
Il modello Gagliardetto Ribassista è formato sul grafico M15 del AUDJPY. Il modello segnala la continuazione del trend discendente nel caso in cui il minimo del gagliardetto di 90.01
I time frame M5 e M15 possono avere più punti di ingresso falsi.
Open chart in a new window
Il modello Bandiera Ribassista è stato formato su USDJPY a M15. Il confine inferiore del modello si trova a 140.89/141.19 mentre il confine superiore si trova a 141.19/141.49. La proiezione
I time frame M5 e M15 possono avere più punti di ingresso falsi.
Open chart in a new window

