
 Rimani

I pattern sono modelli grafici che forma il prezzo nel grafico. Secondo uno dei postulati dell'analisi tecnica, la storia (movimento dei prezzi) si ripete. Ciò significa che i movimenti dei prezzi sono spesso simili nelle stesse situazioni, il che rende possibile prevedere con maggiore probabilità ulteriore sviluppo della situazione.
I pattern pertinenti di InstaForex è un servizio facile da usare che ti consente di conoscere gli ultimi cambiamenti del mercato e reagire agli eventi in tempo. Nel nostro servizio troverai sempre gli schemi più recenti e pertinenti su ogni coppia a qualunque ora.
was formed on 31.03 at 16:26:39 (UTC+0)
signal strength 2 of 5
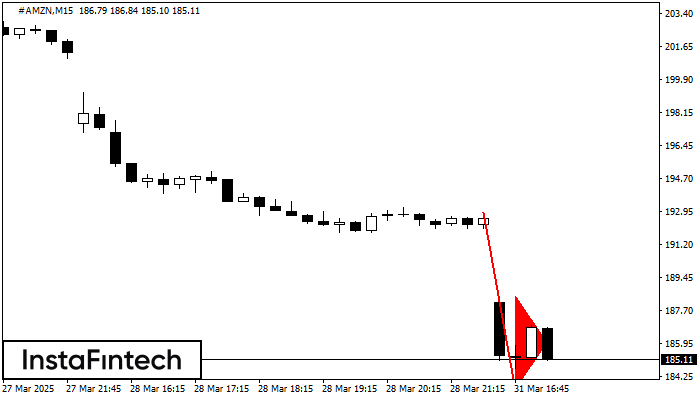
The Bearish pennant pattern has formed on the #AMZN M15 chart. The pattern signals continuation of the downtrend in case the pennant’s low of 183.52 is broken through. Recommendations: Place the sell stop pending order 10 pips below the pattern’s low. Place the take profit order at the projection distance of the flagpole height.
The M5 and M15 time frames may have more false entry points.
- All
- Double Top
- Flag
- Head and Shoulders
- Pennant
- Rectangle
- Triangle
- Triple top
- All
- #AAPL
- #AMZN
- #EBAY
- #FB
- #GOOG
- #INTC
- #KO
- #MA
- #MCD
- #MSFT
- #NTDOY
- #PEP
- #TSLA
- #TWTR
- AUDCAD
- AUDCHF
- AUDJPY
- AUDUSD
- EURCAD
- EURCHF
- EURGBP
- EURJPY
- EURNZD
- EURRUB
- EURUSD
- GBPAUD
- GBPCHF
- GBPJPY
- GBPUSD
- GOLD
- NZDCAD
- NZDCHF
- NZDJPY
- NZDUSD
- SILVER
- USDCAD
- USDCHF
- USDJPY
- USDRUB
- All
- M5
- M15
- M30
- H1
- D1
- All
- Buy
- Sale
- All
- 1
- 2
- 3
- 4
- 5

Secondo il grafico di M5, GBPAUD ha formato il modello Triangolo Simmetrico Rialzista. Il confine inferiore del modello tocca le coordinate 2.0704/2.0775 mentre il confine superiore attraversa 2.0831/2.0775
I time frame M5 e M15 possono avere più punti di ingresso falsi.
Open chart in a new window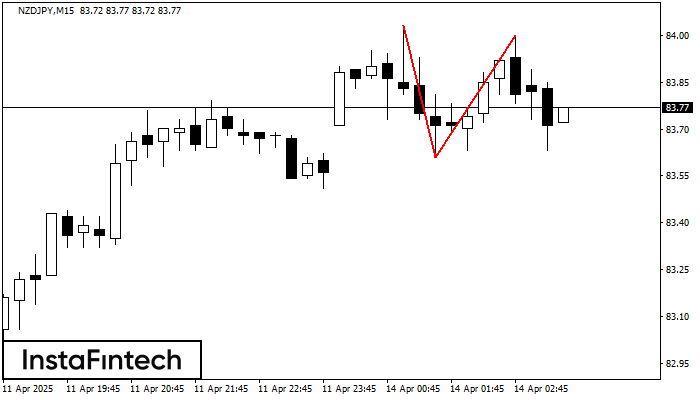
Il modello di inversione Doppio Massimo è stato formato su NZDJPY M15. Caratteristiche: il confine superiore 84.03; il confine inferiore 83.61; la larghezza del modello è di 39 punti
I time frame M5 e M15 possono avere più punti di ingresso falsi.
Open chart in a new window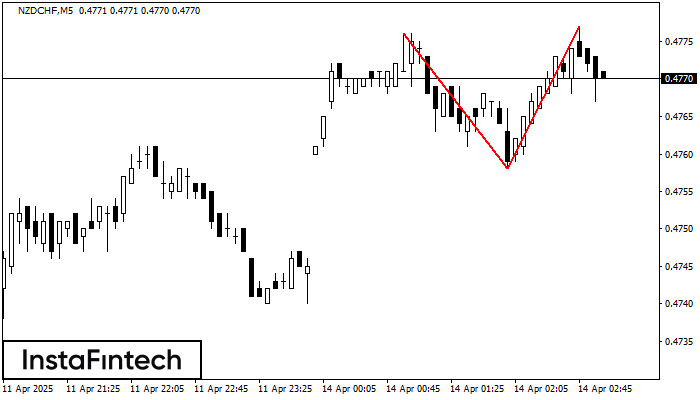
Il modello di inversione Doppio Massimo è stato formato su NZDCHF M5. Caratteristiche: il confine superiore 0.4776; il confine inferiore 0.4758; la larghezza del modello è di 19 punti
I time frame M5 e M15 possono avere più punti di ingresso falsi.
Open chart in a new window


