
 Rimani

I pattern sono modelli grafici che forma il prezzo nel grafico. Secondo uno dei postulati dell'analisi tecnica, la storia (movimento dei prezzi) si ripete. Ciò significa che i movimenti dei prezzi sono spesso simili nelle stesse situazioni, il che rende possibile prevedere con maggiore probabilità ulteriore sviluppo della situazione.
I pattern pertinenti di InstaForex è un servizio facile da usare che ti consente di conoscere gli ultimi cambiamenti del mercato e reagire agli eventi in tempo. Nel nostro servizio troverai sempre gli schemi più recenti e pertinenti su ogni coppia a qualunque ora.
was formed on 02.04 at 04:20:19 (UTC+0)
signal strength 1 of 5
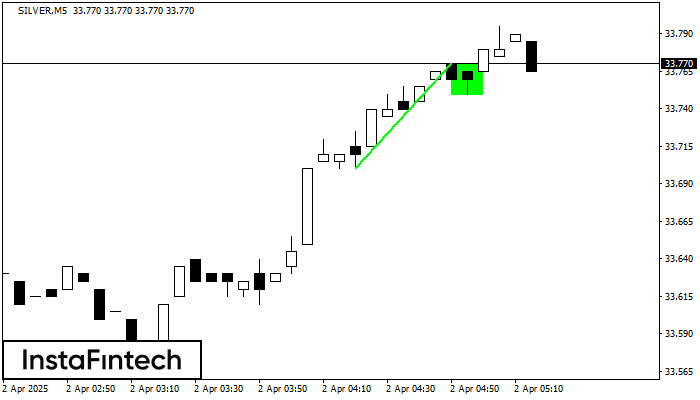
The Bullish Flag pattern has been formed on the chart SILVER M5 which signals that the upward trend will continue. Signals: а break of the peak at 33.77 may push the price higher, and the rise will be the projection of the pole.
The M5 and M15 time frames may have more false entry points.
Guardate inoltre
- All
- Double Top
- Flag
- Head and Shoulders
- Pennant
- Rectangle
- Triangle
- Triple top
- All
- #AAPL
- #AMZN
- #EBAY
- #FB
- #GOOG
- #INTC
- #KO
- #MA
- #MCD
- #MSFT
- #NTDOY
- #PEP
- #TSLA
- #TWTR
- AUDCAD
- AUDCHF
- AUDJPY
- AUDUSD
- EURCAD
- EURCHF
- EURGBP
- EURJPY
- EURNZD
- EURRUB
- EURUSD
- GBPAUD
- GBPCHF
- GBPJPY
- GBPUSD
- GOLD
- NZDCAD
- NZDCHF
- NZDJPY
- NZDUSD
- SILVER
- USDCAD
- USDCHF
- USDJPY
- USDRUB
- All
- M5
- M15
- M30
- H1
- D1
- All
- Buy
- Sale
- All
- 1
- 2
- 3
- 4
- 5

The Double Bottom pattern has been formed on USDCAD M15; the upper boundary is 1.3801; the lower boundary is 1.3791. The width of the pattern is 11 points. In case
The M5 and M15 time frames may have more false entry points.
Open chart in a new window
The Bullish pennant signal – Trading instrument NZDCAD M5, continuation pattern. Forecast: it is possible to set up a buy position above the pattern’s high of 0.8304, with the prospect
The M5 and M15 time frames may have more false entry points.
Open chart in a new window
The Bullish pennant graphic pattern has formed on the NZDUSD M5 instrument. This pattern type falls under the category of continuation patterns. In this case, if the quote can breaks
The M5 and M15 time frames may have more false entry points.
Open chart in a new window


