
 Rimani


I pattern sono modelli grafici che forma il prezzo nel grafico. Secondo uno dei postulati dell'analisi tecnica, la storia (movimento dei prezzi) si ripete. Ciò significa che i movimenti dei prezzi sono spesso simili nelle stesse situazioni, il che rende possibile prevedere con maggiore probabilità ulteriore sviluppo della situazione.
I pattern pertinenti di InstaForex è un servizio facile da usare che ti consente di conoscere gli ultimi cambiamenti del mercato e reagire agli eventi in tempo. Nel nostro servizio troverai sempre gli schemi più recenti e pertinenti su ogni coppia a qualunque ora.
was formed on 02.04 at 20:25:18 (UTC+0)
signal strength 1 of 5
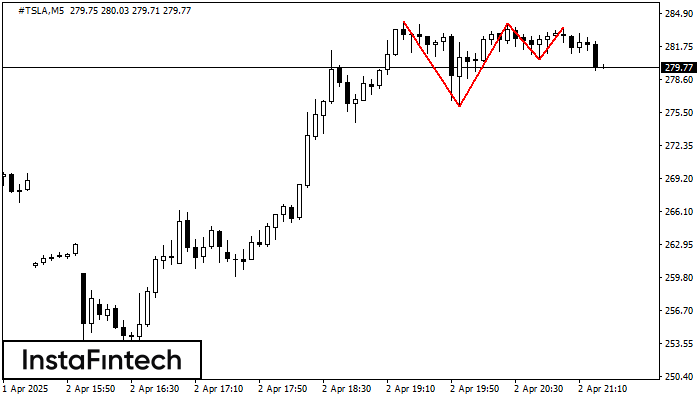
On the chart of the #TSLA M5 trading instrument, the Triple Top pattern that signals a trend change has formed. It is possible that after formation of the third peak, the price will try to break through the resistance level 276.07, where we advise to open a trading position for sale. Take profit is the projection of the pattern’s width, which is 805 points.
The M5 and M15 time frames may have more false entry points.
Guardate inoltre
- All
- Double Top
- Flag
- Head and Shoulders
- Pennant
- Rectangle
- Triangle
- Triple top
- All
- #AAPL
- #AMZN
- #EBAY
- #FB
- #GOOG
- #INTC
- #KO
- #MA
- #MCD
- #MSFT
- #NTDOY
- #PEP
- #TSLA
- #TWTR
- AUDCAD
- AUDCHF
- AUDJPY
- AUDUSD
- EURCAD
- EURCHF
- EURGBP
- EURJPY
- EURNZD
- EURRUB
- EURUSD
- GBPAUD
- GBPCHF
- GBPJPY
- GBPUSD
- GOLD
- NZDCAD
- NZDCHF
- NZDJPY
- NZDUSD
- SILVER
- USDCAD
- USDCHF
- USDJPY
- USDRUB
- All
- M5
- M15
- M30
- H1
- D1
- All
- Buy
- Sale
- All
- 1
- 2
- 3
- 4
- 5
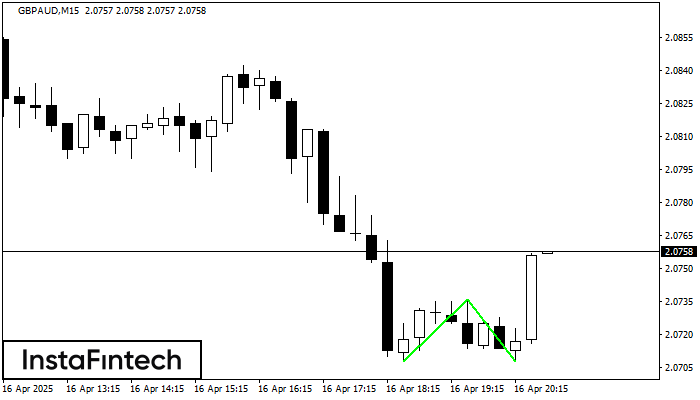
Il modello Doppio Minimo è stato formato su GBPAUD M15; il confine superiore è 2.0736; il confine inferiore è 2.0708. La larghezza del modello è di 28 punti. In caso
I time frame M5 e M15 possono avere più punti di ingresso falsi.
Open chart in a new window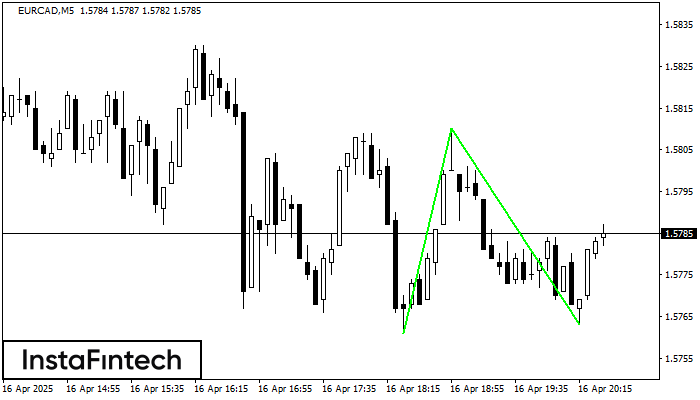
Il modello Doppio Minimo è stato formato su EURCAD M5; il confine superiore è 1.5810; il confine inferiore è 1.5763. La larghezza del modello è di 49 punti. In caso
I time frame M5 e M15 possono avere più punti di ingresso falsi.
Open chart in a new window
Il modello Doppio Minimo è stato formato su EURCAD M15. Caratteristiche: il livello di supporto 1.5761; il livello di resistenza 1.5810; la larghezza del modello 49 punti. Se il livello
I time frame M5 e M15 possono avere più punti di ingresso falsi.
Open chart in a new window


