
 Rimani


I pattern sono modelli grafici che forma il prezzo nel grafico. Secondo uno dei postulati dell'analisi tecnica, la storia (movimento dei prezzi) si ripete. Ciò significa che i movimenti dei prezzi sono spesso simili nelle stesse situazioni, il che rende possibile prevedere con maggiore probabilità ulteriore sviluppo della situazione.
I pattern pertinenti di InstaForex è un servizio facile da usare che ti consente di conoscere gli ultimi cambiamenti del mercato e reagire agli eventi in tempo. Nel nostro servizio troverai sempre gli schemi più recenti e pertinenti su ogni coppia a qualunque ora.
was formed on 03.04 at 13:24:54 (UTC+0)
signal strength 1 of 5
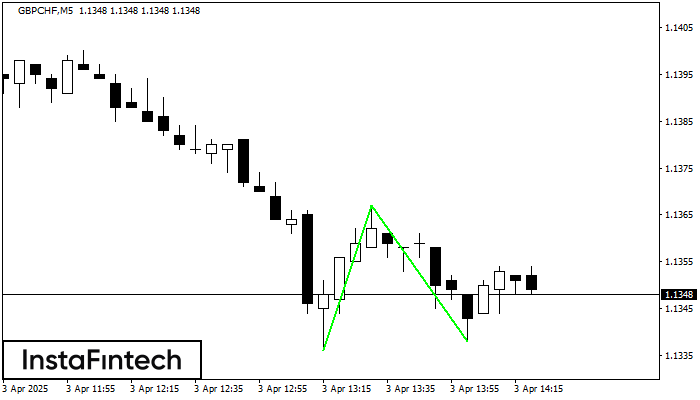
The Double Bottom pattern has been formed on GBPCHF M5. Characteristics: the support level 1.1336; the resistance level 1.1367; the width of the pattern 31 points. If the resistance level is broken, a change in the trend can be predicted with the first target point lying at the distance of 29 points.
The M5 and M15 time frames may have more false entry points.
Guardate inoltre
- All
- Double Top
- Flag
- Head and Shoulders
- Pennant
- Rectangle
- Triangle
- Triple top
- All
- #AAPL
- #AMZN
- #EBAY
- #FB
- #GOOG
- #INTC
- #KO
- #MA
- #MCD
- #MSFT
- #NTDOY
- #PEP
- #TSLA
- #TWTR
- AUDCAD
- AUDCHF
- AUDJPY
- AUDUSD
- EURCAD
- EURCHF
- EURGBP
- EURJPY
- EURNZD
- EURRUB
- EURUSD
- GBPAUD
- GBPCHF
- GBPJPY
- GBPUSD
- GOLD
- NZDCAD
- NZDCHF
- NZDJPY
- NZDUSD
- SILVER
- USDCAD
- USDCHF
- USDJPY
- USDRUB
- All
- M5
- M15
- M30
- H1
- D1
- All
- Buy
- Sale
- All
- 1
- 2
- 3
- 4
- 5
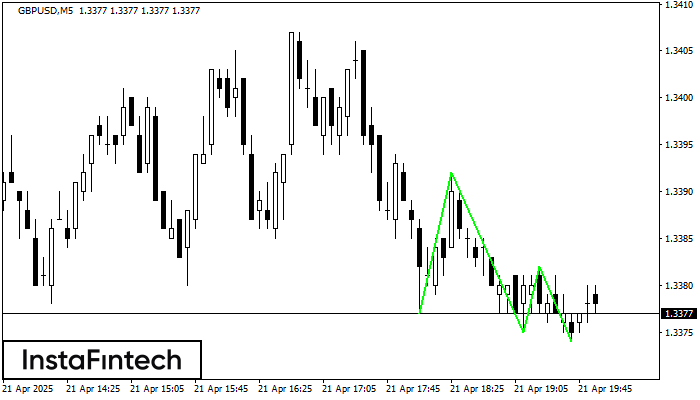
Il modello Triplo Minimo è stato formato su GBPUSD M5. Ha le seguenti caratteristiche: livello di resistenza 1.3392/1.3382; livello di supporto 1.3377/1.3374; la larghezza è 15 punti. In caso
I time frame M5 e M15 possono avere più punti di ingresso falsi.
Open chart in a new window
Il modello Triplo Minimo si è formato sul grafico dello strumento di trading #AMZN M5. Il modello segnala un cambiamento nel trend dal discendente all'ascendente in caso di rottura
I time frame M5 e M15 possono avere più punti di ingresso falsi.
Open chart in a new window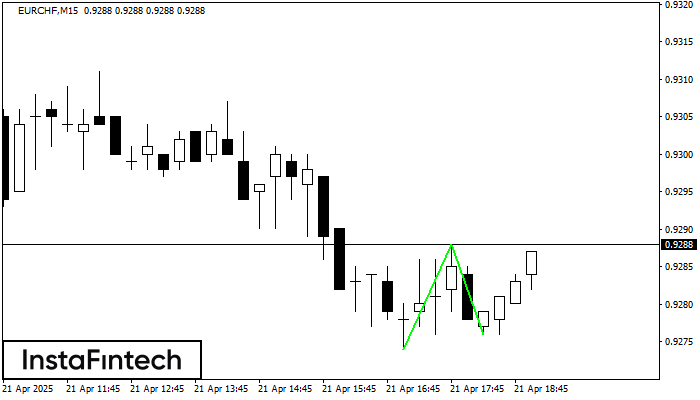
Il modello Doppio Minimo è stato formato su EURCHF M15. Questa formazione segnala un'inversione del trend dal discendente all'ascendente. Il segnale è che una posizione buy dovrebbe essere aperta dopo
I time frame M5 e M15 possono avere più punti di ingresso falsi.
Open chart in a new window


