
 Rimani

I pattern sono modelli grafici che forma il prezzo nel grafico. Secondo uno dei postulati dell'analisi tecnica, la storia (movimento dei prezzi) si ripete. Ciò significa che i movimenti dei prezzi sono spesso simili nelle stesse situazioni, il che rende possibile prevedere con maggiore probabilità ulteriore sviluppo della situazione.
I pattern pertinenti di InstaForex è un servizio facile da usare che ti consente di conoscere gli ultimi cambiamenti del mercato e reagire agli eventi in tempo. Nel nostro servizio troverai sempre gli schemi più recenti e pertinenti su ogni coppia a qualunque ora.
was formed on 14.04 at 03:00:24 (UTC+0)
signal strength 2 of 5

The Triple Bottom pattern has been formed on EURNZD M15. It has the following characteristics: resistance level 1.9498/1.9463; support level 1.9409/1.9402; the width is 89 points. In the event of a breakdown of the resistance level of 1.9498, the price is likely to continue an upward movement at least to 1.9412.
The M5 and M15 time frames may have more false entry points.
Guardate inoltre
- All
- Double Top
- Flag
- Head and Shoulders
- Pennant
- Rectangle
- Triangle
- Triple top
- All
- #AAPL
- #AMZN
- #EBAY
- #FB
- #GOOG
- #INTC
- #KO
- #MA
- #MCD
- #MSFT
- #NTDOY
- #PEP
- #TSLA
- #TWTR
- AUDCAD
- AUDCHF
- AUDJPY
- AUDUSD
- EURCAD
- EURCHF
- EURGBP
- EURJPY
- EURNZD
- EURRUB
- EURUSD
- GBPAUD
- GBPCHF
- GBPJPY
- GBPUSD
- GOLD
- NZDCAD
- NZDCHF
- NZDJPY
- NZDUSD
- SILVER
- USDCAD
- USDCHF
- USDJPY
- USDRUB
- All
- M5
- M15
- M30
- H1
- D1
- All
- Buy
- Sale
- All
- 1
- 2
- 3
- 4
- 5

Secondo il grafico di M30, NZDJPY ha formato il modello Triangolo Simmetrico Ribassista. Descrizione: Il confine inferiore è 83.98/84.43 e il confine superiore è 84.90/84.43. La larghezza del modello
Open chart in a new window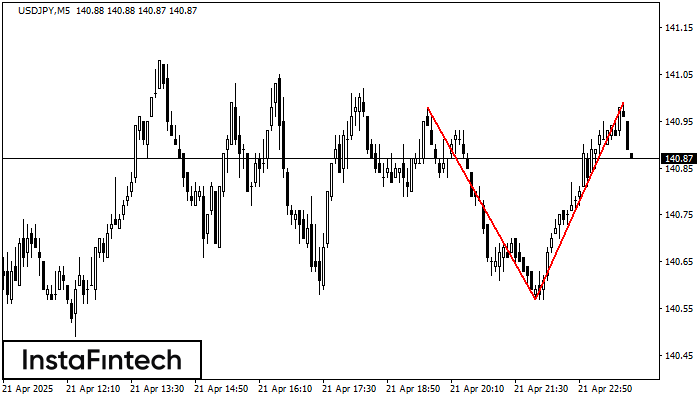
Il modello di inversione Doppio Massimo è stato formato su USDJPY M5. Caratteristiche: il confine superiore 140.98; il confine inferiore 140.57; la larghezza del modello è di 42 punti
I time frame M5 e M15 possono avere più punti di ingresso falsi.
Open chart in a new window
Secondo il grafico di M5, #Bitcoin ha formato il modello Triangolo Simmetrico Rialzista, che segnala che il trend continuerà. Descrizione: Il confine superiore del modello tocca le coordinate 88419.31/87233.62 mentre
I time frame M5 e M15 possono avere più punti di ingresso falsi.
Open chart in a new window


