Warunki handlowe
Narzędzia

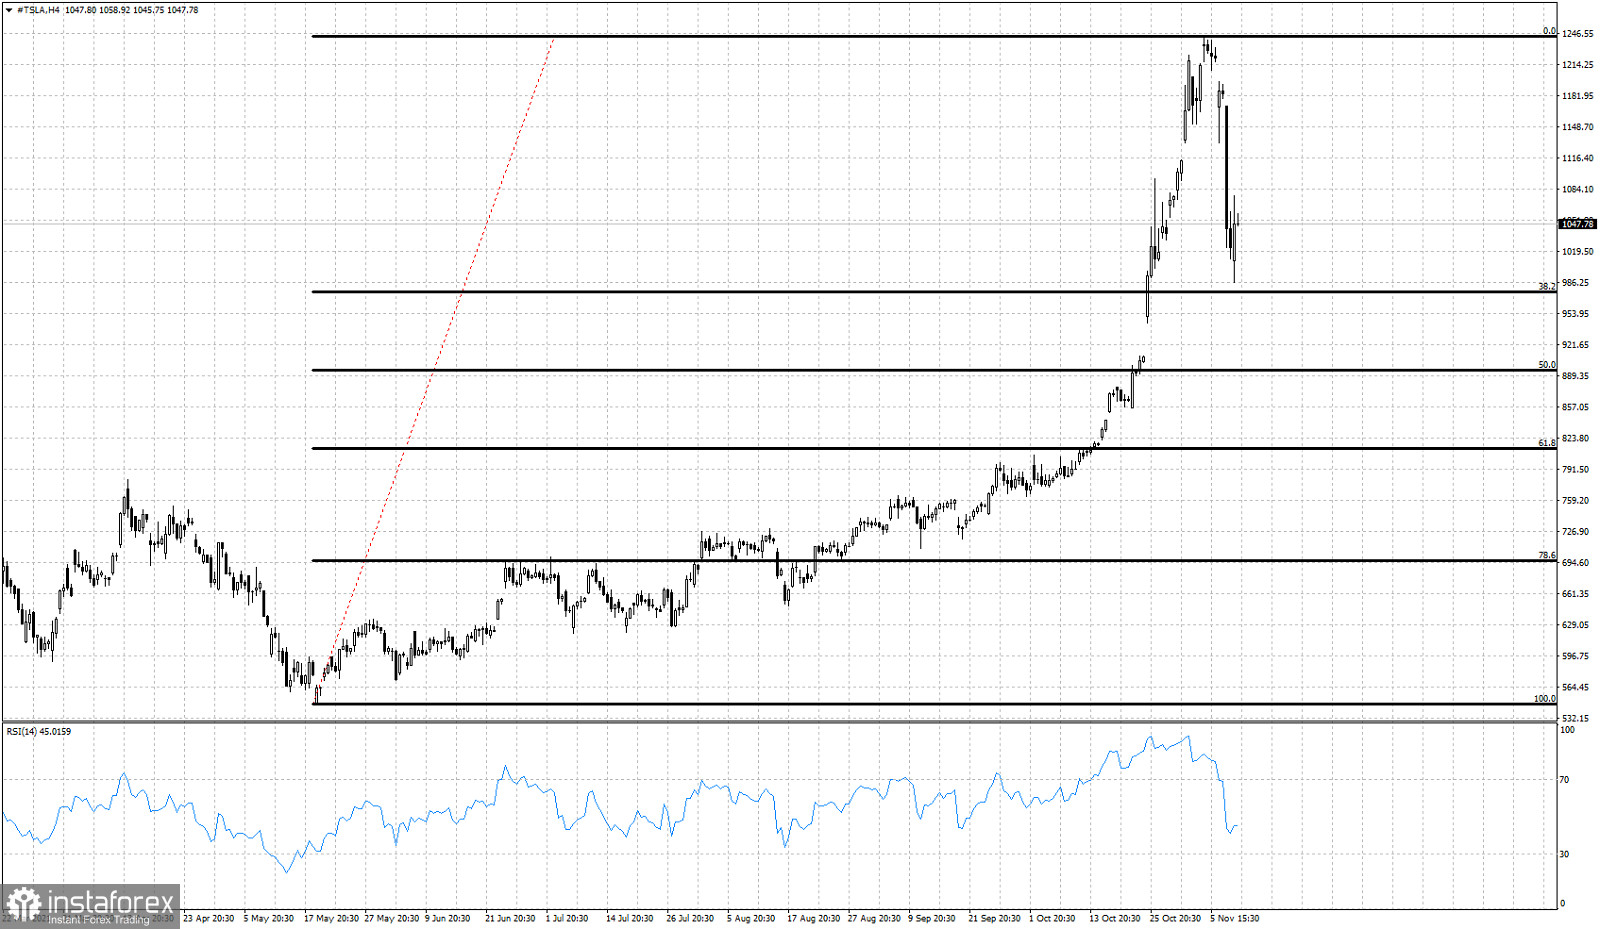
In our previous analysis on TSLA stock price I noted it was time to stop being bullish and at least turn neutral. Price has since then pulled back towards $1,000 where we had our target area of $1,000 and $970.
Black lines - Fibonacci rertacementsTSLA stock price has already reached our downside pull back target. Price will find support at current levels at the 38% Fibonacci level of the decline. This does not rule out a shallow bounce and a new lower low. Trend is bearish and so far we consider each bounce as a selling opportunity. We continue to prefer to avoid this stock.
Dzięki analizom InstaForex zawsze będziesz na bieżące z trendami rynkowymi! Zarejestruj się w InstaForex i uzyskaj dostęp do jeszcze większej liczby bezpłatnych usług dla zyskownego handlu.
Możemy używać plików cookies do analizowania danych odwiedzających, ulepszania naszej strony internetowej i pomiaru wydajności reklam. Dane te są wykorzystywane w celu zapewnienia lepszej obsługi naszej strony internetowej. Więcej informacji.
Your IP address shows that you are currently located in the USA. If you are a resident of the United States, you are prohibited from using the services of Instant Trading EU Ltd including online trading, online transfers, deposit/withdrawal of funds, etc.
If you think you are seeing this message by mistake and your location is not the US, kindly proceed to the website. Otherwise, you must leave the website in order to comply with government restrictions.
Why does your IP address show your location as the USA?
Please confirm whether you are a US resident or not by clicking the relevant button below. If you choose the wrong option, being a US resident, you will not be able to open an account with InstaForex anyway.
We are sorry for any inconvenience caused by this message.
 Anuluj


