 Anuluj
Warunki handlowe
Narzędzia


Early in the American session, gold is falling, erasing part of the rebound from the low of 1,931. XAU/USD reached 1,858 in the Asian session, but then reversed direction and fell to 1,841.
Gold falls as a result of further declines in the world stock markets and concerns about global growth. This puts downward pressure on commodity prices and strengthens the US dollar.
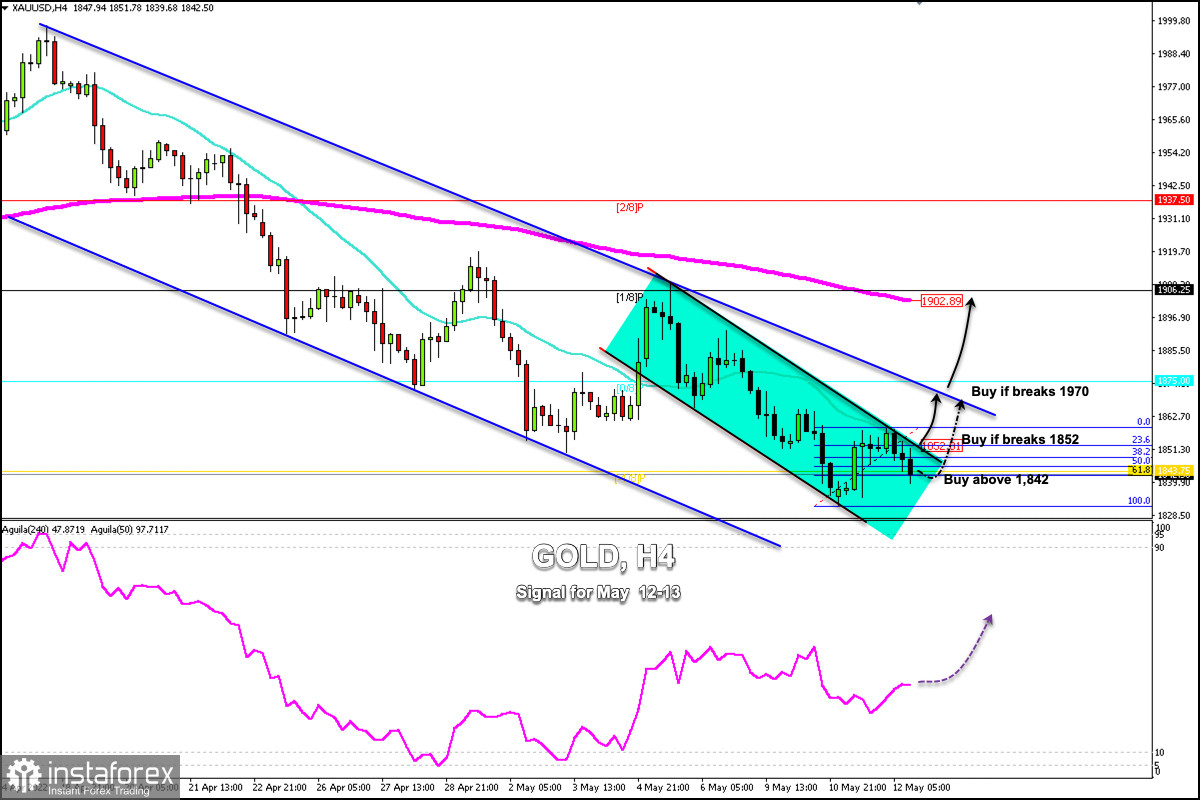
According to the 4-hour chart, we can see that gold is trading at around 1,842. This level coincides with the 61.8% Fibonacci retracement (1,931-1,958).
We can also see that gold is trying to consolidate above -1/8 Murray located at 1,843, an extremely oversold level. If gold continues to trade above this level in the next few hours, we could expect a recovery.
Additionally, we can see that the 21 SMA is located at 1,852, just at the same level where the top of the short-term bearish channel is located. A sharp break above 1,852 and a close on the 4-hour chart could ease the downside pressure and gold could reach the level of 1,870.
We can see on the 4-hour chart that since April 14 gold has been under downward pressure after approaching the psychological level of 2,000.
A sharp break of this medium-term trend channel and a close on daily charts above 1,970 could mean a trend reversal and we could expect it to reach 200 EMA at 1,902 and could even reach 2/8 Murray at 1,937.
Our trading plan for the next few hours is to buy gold at around the 61.8% Fibonacci level at 1,842, with targets at 1,852 and 1,870. The eagle indicator is giving a positive signal which supports our bullish strategy.
Dzięki analizom InstaForex zawsze będziesz na bieżące z trendami rynkowymi! Zarejestruj się w InstaForex i uzyskaj dostęp do jeszcze większej liczby bezpłatnych usług dla zyskownego handlu.


