 Anuluj
Warunki handlowe
Narzędzia


The final data on the UK GDP for the third quarter unexpectedly turned out to be better than forecasts. Preliminary estimates previously indicated a slowdown in economic growth from 23.6% to 6.6%. However, the results of the second quarter were revised for the better, namely to 24.2%. According to the results of the third quarter, the growth rate was 6.8%.
The pound stood still when the data was released, but after a while, it strengthened.
The US GDP in the third quarter increased by 2.3% in annual terms. The growth was worse than what was expected by experts. GDP was expected to increase by 2.8%. It is assumed that one of the factors of this was the problems related to disruptions in the supply chains of goods in the country.
The US also published its home sales data in the secondary market, which grew by only 1.9% against the forecast of 2.7%.
In general, the US statistics are worse than expected. The US dollar was under pressure from sellers.
Analysis of trading charts from December 22:
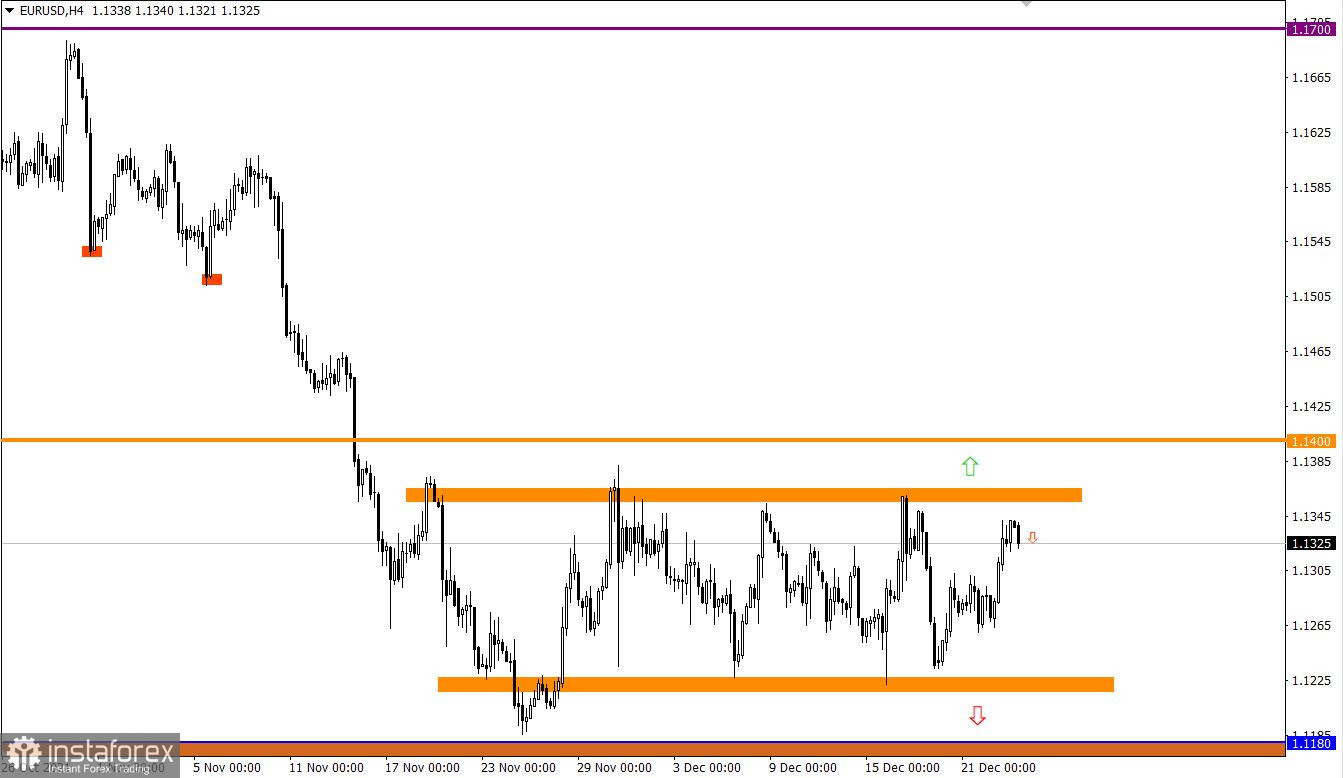
The EUR/USD pair showed activity again after a short stagnation, which resulted in a sharp upward movement. This returned the quote to the upper border of the side channel 1.1225/1.1355.
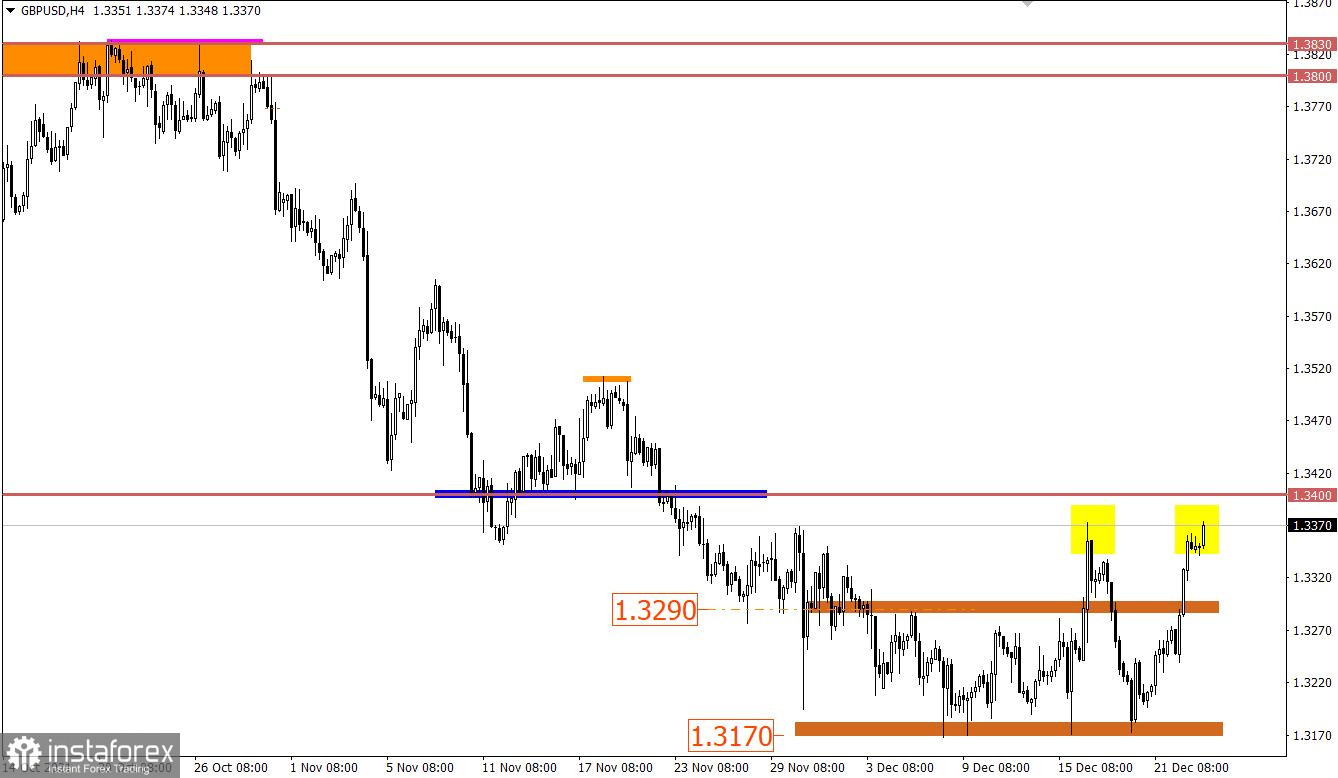
The British currency gained more than 100 points against the US dollar yesterday. This led to a convergence of the price with the area of the local high on December 16, where a reduction in the volume of long positions was previously observed.
Despite a fairly strong price increase, there is still a downward trend relative to the daily period.

December 23 economic calendar:
The United States will release its durable goods orders today, which could rise 1.1%, indicating further growth in consumer activity. At the same time, we have claims for unemployment benefits in the United States, where their volume is expected to be reduced.
Details of statistics:
The volume of initial applications for benefits may fall from 206 thousand to 205 thousand.
The volume of repeated applications for benefits may fall from 1,845 thousand to 1,820 thousand.
Time targeting:
Orders for durable goods - 13:30 Universal time
Applications for unemployment benefits - 13:30 Universal time
Trading plan for EUR/USD on December 23:
Despite a number of speculative surges, traders are still inclined to rebound trading tactics relative to the set borders of the flat. If expectations coincide, the area of the upper border at 1.1355 may increase interest in short positions in the direction of 1.1290.
An alternative scenario, which is also the most profitable, is the method of breaking through one or another flat border. In this case, patience and time are needed here, since the side channel will end sooner or later.
Trading plan for GBP/USD on December 23:
Speculative interest is still observed in this situation, which pushes buyers to break through the local high on December 16. So, a signal for subsequent purchases will appear in the market when the price is holding above the level of 1.3375 in a four-hour period. This step may start the process of inertia towards 1.3400.
An alternative scenario considers the process of slowing down relative to the current levels.
A candlestick chart view is graphical rectangles of white and black light, with sticks on top and bottom. When analyzing each candle in detail, you will see its characteristics of a relative period: the opening price, closing price, and maximum and minimum prices.
Horizontal levels are price coordinates, relative to which a stop or a price reversal may occur. These levels are called support and resistance in the market.
Circles and rectangles are highlighted examples where the price of the story unfolded. This color selection indicates horizontal lines that may put pressure on the quote in the future.
The up/down arrows are the reference points of the possible price direction in the future.
Dzięki analizom InstaForex zawsze będziesz na bieżące z trendami rynkowymi! Zarejestruj się w InstaForex i uzyskaj dostęp do jeszcze większej liczby bezpłatnych usług dla zyskownego handlu.

