 Anuluj
Warunki handlowe
Narzędzia


The revised UK GDP data came in weaker than the preliminary score. The UK GDP slacked off from 4.0% to 1.9% on year. Interestingly, the market gave no strong response to the dismal statistics.
During the New York session yesterday, market participants got to know similar data on the US economic output. Unlike Great Britain, in the revised reading, the US economy expanded 3.2% sequentially in Q3 2022.
Besides, the US Labor Department released a weekly update on US unemployment claims. The report logged a minor decrease in continuing jobless claims last week.
In particular, continuing unemployment claims fell from 1,678 mln to 1,672 mln.
Initial unemployment claims rose from 214K to 216K.
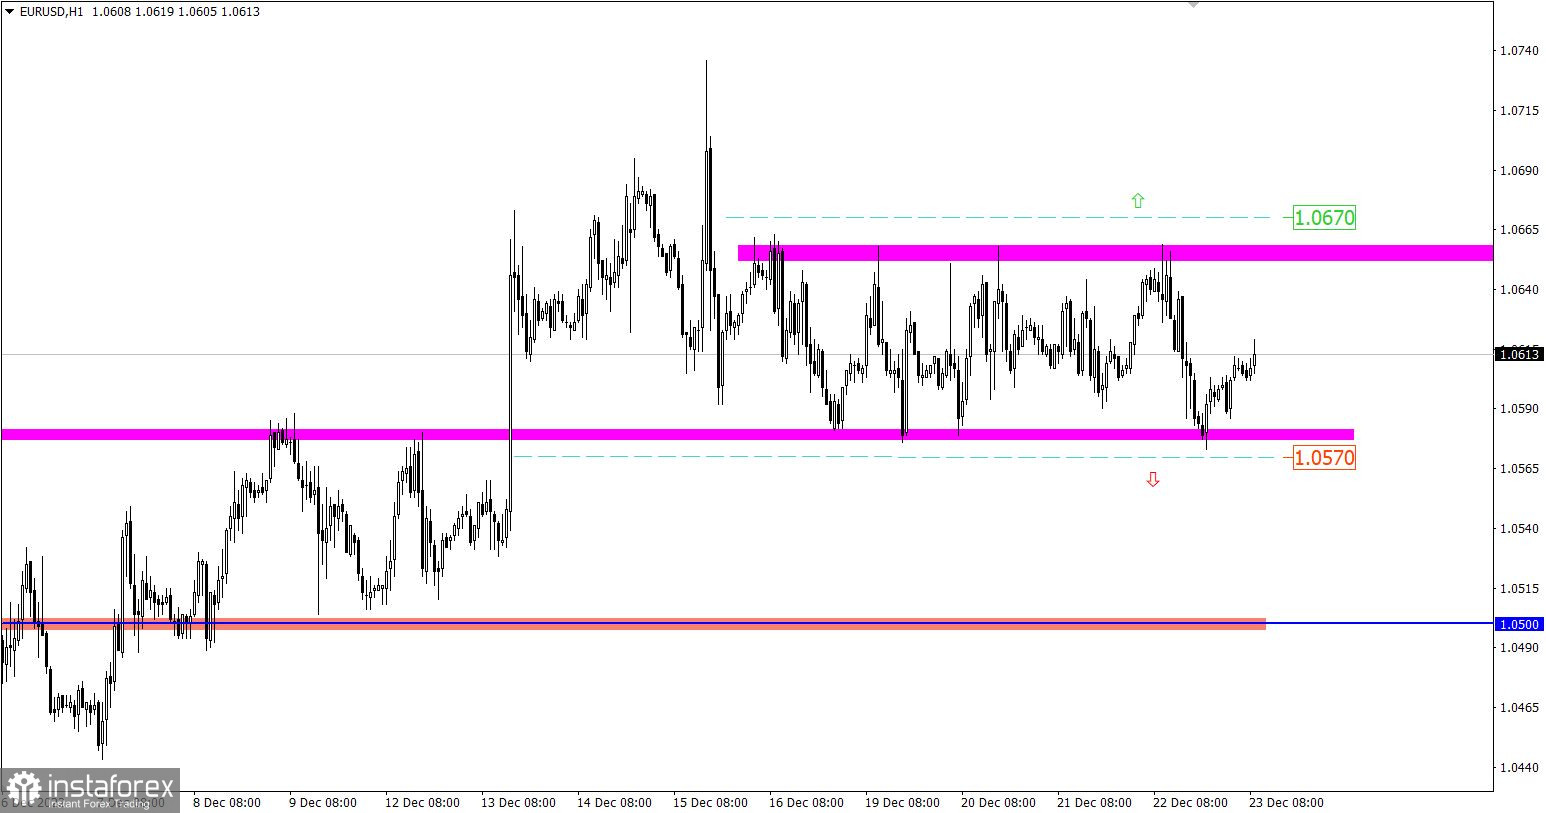
EUR/USD has been trapped in a range between 1.0580 and 1.0660 for a week. The currency pair is trading with moderate volatility. In essence, the pair has been accumulating trading forces which commonly happens when a trading instrument has got stuck on a range-bound market.
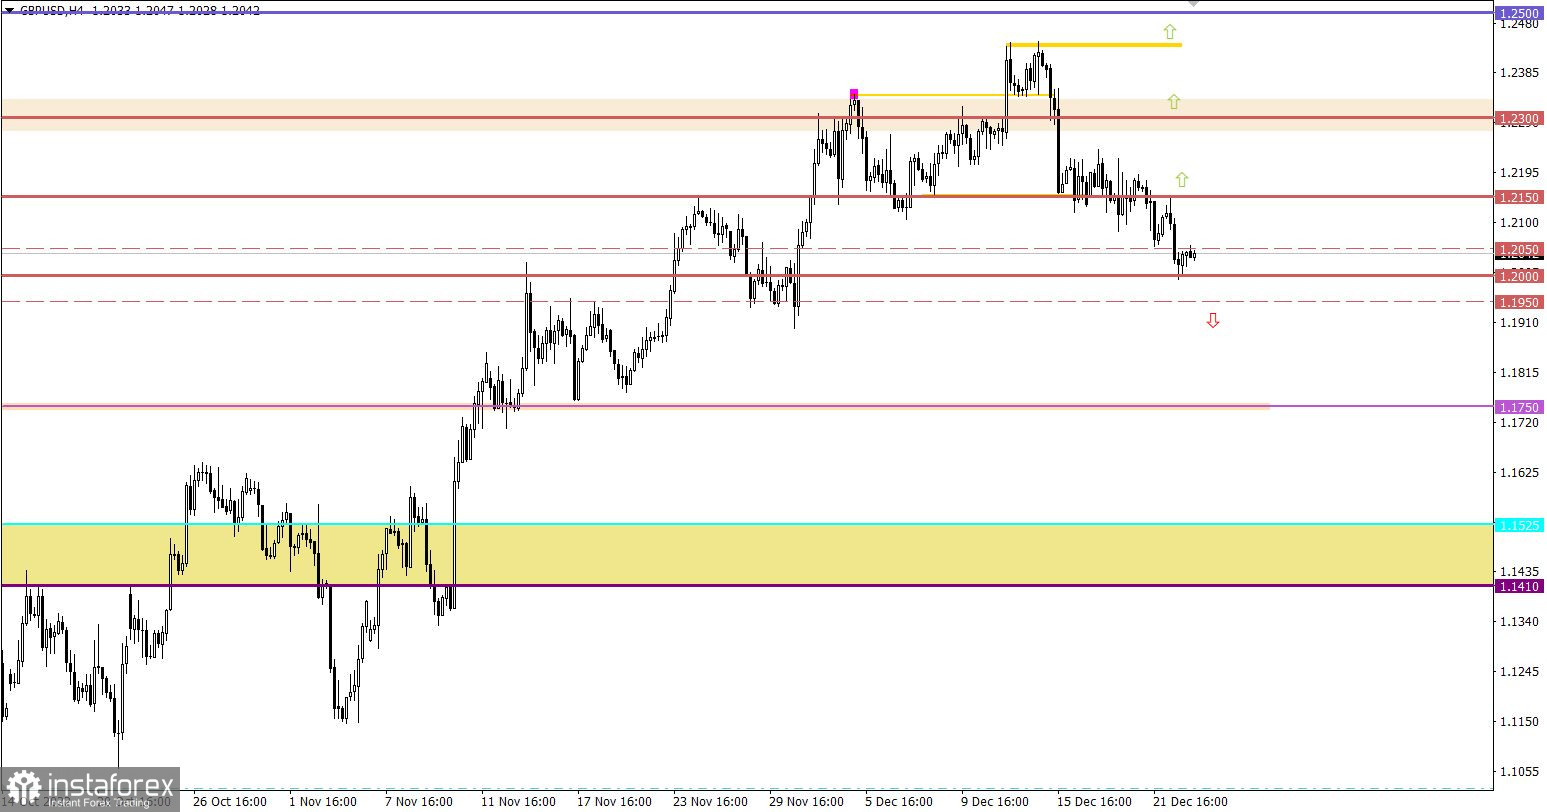
GBP/USD dropped off 1.2150 and shortly after retreated to the psychological level of 1.2000. To sum up a weekly dynamic, GBP/USD lost 3.5% or almost 450 pips. At the same time, even with such a steep fall, the currency pair is still following the overall upward cycle from the lows of the downtrend line.

Today is the day before the Christmas holiday. The only report worthy of attention is the US durable goods orders which are expected to decline in November. The data will hardly make a serious impact on market sentiment.
On tap
US durable goods orders for November are due at 13:30 GMT
Commonly, a range-bound market does not last for the medium or the long term. Indeed, a week later, a trading range becomes unstable. Such market conditions set the stage for a breakout of any of its borders soon.
To sum up, there are two scenarios.
The upward scenario will come into play in case the price settles above 1.6770 in the 4-hour timeframe. This move will reinforce long positions that will enable the pair to update a local high of the upward cycle.
The downward scenario will be accepted in case the price settles below 1.0570 in the 4-hour timeframe. As a result, the price could retreat to 1.0500.
Under such market conditions, the price settlement below 1.1950 could be a signal of a further increase in short positions. In this case, the ongoing correctional decline will be extended. Eventually, it could change trading sentiment.
Otherwise, the area of 1.1950/1.2000/1.2050 will assure traders to cut on short positions. This will enable a slowdown or completion of the downward correction.
The candlestick chart type is white and black graphic rectangles with lines above and below. With a detailed analysis of each individual candle, you can see its characteristics relative to a particular time frame: the opening price, closing price, intraday high and low.
Horizontal levels are price coordinates, relative to which a price may stop or reverse its trajectory. In the market, these levels are called support and resistance.
Circles and rectangles are highlighted examples where the price reversed in history. This color highlighting indicates horizontal lines that may put pressure on the asset's price in the future.
The up/down arrows are landmarks of the possible price direction in the future.
Dzięki analizom InstaForex zawsze będziesz na bieżące z trendami rynkowymi! Zarejestruj się w InstaForex i uzyskaj dostęp do jeszcze większej liczby bezpłatnych usług dla zyskownego handlu.


