 Anuluj
Warunki handlowe
Narzędzia


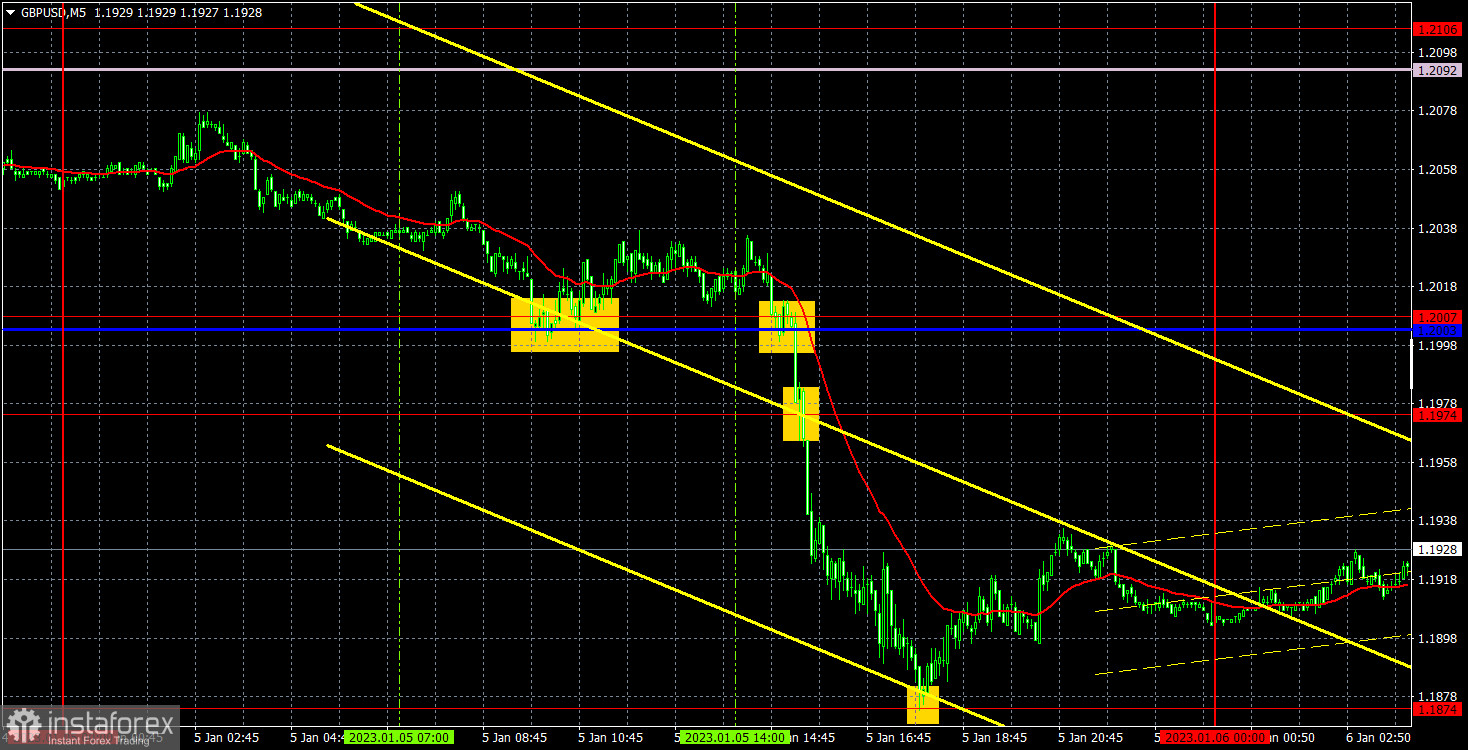
On Thursday, GBP/USD showed similar movements to EUR/USD. The pound also left the horizontal channel for the second time and settled below the Ichimoku indicator lines. Thus, we are entitled to expect the continuation of the downtrend and the descending movement. I believe that the pound, which falls longer and sharper than the euro, has not exhausted its potential to decline. Yesterday, its macroeconomic background was almost the same as for the EUR/USD pair. So there is nothing new to say about it. I believe that the pound would fall even if the dollar does not receive any macroeconomic and fundamental support. Simply because it is up 2,000 points in 2.5 months, which is 50% of the two-year, global, downtrend. The dollar might fall today if the data turns out to be disappointing, but I think that traders are now in favor of buying the dollar, so they will try to interpret any report in its favor.
The trading signals on Thursday were just fine. First, the pair formed a false buy signal near 1.2007, but it failed to go up even 20 pips. But the next sell signal near the same level turned out to be strong and was correct, and the price went down to 1.1874. Therefore, traders were able to earn about 75 pips on the short position, which covered the losses on the first trade and so they still earned profit. The buy signal near 1.1874 should not have been used as it was formed too late.
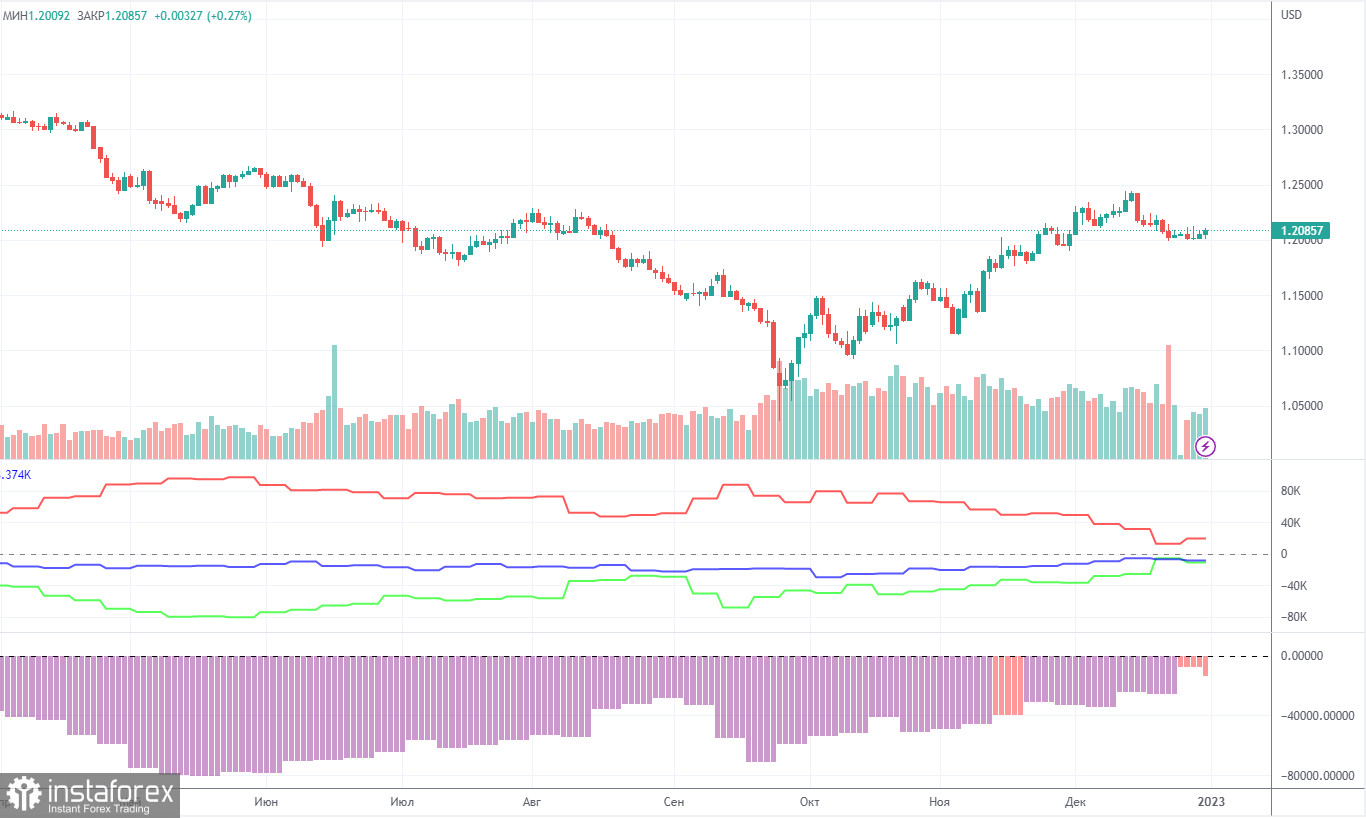
The latest COT report showed that bearish sentiment had weakened. During the given period, non-commercial traders opened 5,300 long positions and as many as 10,600 short positions. Thus, the net position fell by about 5,300. This figure has been on the rise for several months, and the sentiment may become bullish in the near future. Although the pound has grown against the dollar for the last few weeks, it is still difficult to answer why it keeps rising. On the other hand, it could fall in the near future (in the mid-term prospect) because it still needs a correction. In general, in recent months the COT reports correspond to the pound's movements so there shouldn't be any questions. Since the net position is not even bullish yet, buying may continue for a few months to come. Non-commercial traders now hold 40,600,000 long positions and 51,500 short ones. I am still skeptical about the pound's long term growth, though there are technical reasons for it. At the same time, fundamental and geopolitical factors signal that the currency is unlikely to strengthen significantly.
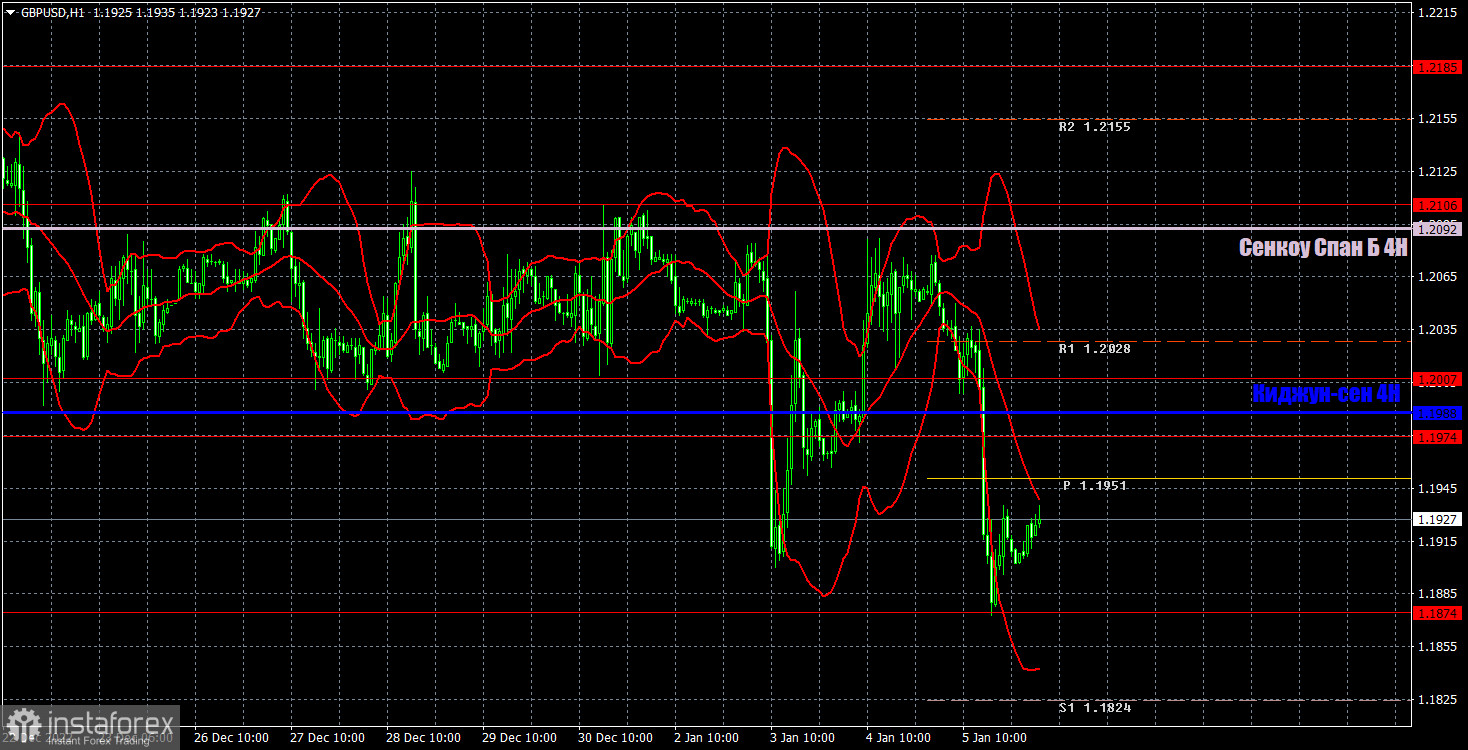
On the one-hour chart, GBP/USD is trying to resume the downward movement, and it succeeds. Today the pair's movement will depend entirely on the macroeconomic background, so there is still a possibility that it could move upward. But I expect the pound to move down in the next two to three weeks. On January 6, the pair may trade at the following levels: 1.1486, 1.1645, 1.1760, 1.1874, 1.1974-1.2007, 1.2106, 1.2185, 1.2259. The Senkou Span B (1.2092) and Kijun Sen (1.1988) lines may also generate signals. Pullbacks and breakouts through these lines may produce signals as well. A Stop Loss order should be set at the breakeven point after the price passes 20 pips in the right direction. Ichimoku indicator lines may move during the day, which should be taken into account when determining trading signals. In addition, the chart does illustrate support and resistance levels, which could be used to lock in profits. On Friday, the UK will release its second estimate for the Construction PMI for December. In the US, we will receive data on Nonfarm, unemployment and the ISM Non-Manufacturing PMI. The most interesting things will happen in the afternoon.
Price levels of support and resistance are thick red lines, near which the movement may end. They do not provide trading signals.
The Kijun-sen and Senkou Span B lines are the lines of the Ichimoku indicator, moved to the one-hour chart from the 4-hour one. They are strong lines.
Extreme levels are thin red lines from which the price bounced earlier. They provide trading signals.
Yellow lines are trend lines, trend channels, and any other technical patterns.
Indicator 1 on the COT charts reflects the net position size of each category of traders.
Indicator 2 on the COT charts reflects the net position size for the non-commercial group.
Dzięki analizom InstaForex zawsze będziesz na bieżące z trendami rynkowymi! Zarejestruj się w InstaForex i uzyskaj dostęp do jeszcze większej liczby bezpłatnych usług dla zyskownego handlu.


