 Anuluj
Warunki handlowe
Narzędzia


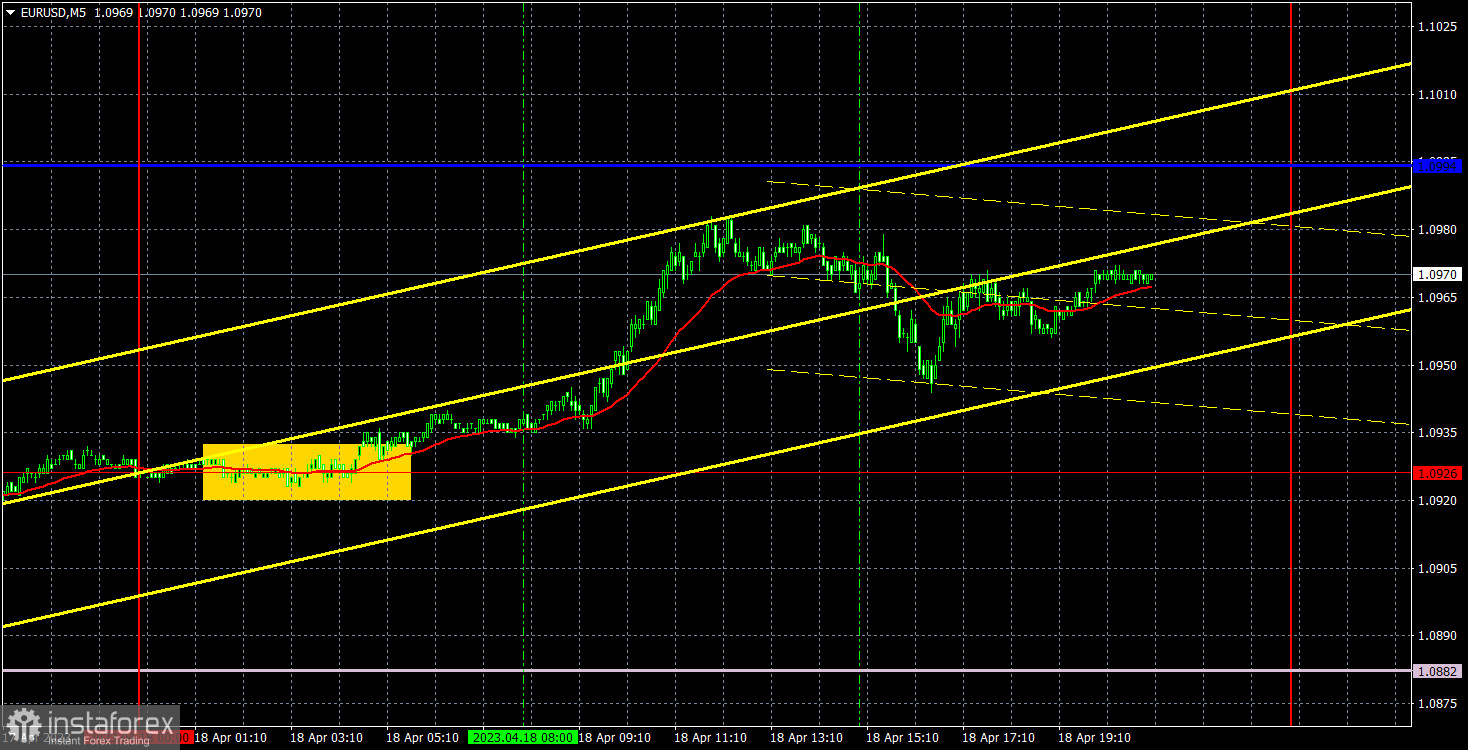
On Tuesday, EUR/USD started to correct against the corrections of the last two days. Volatility was quite low, and there was no fundamental background. Therefore, there was nothing for traders to react to, and all of Tuesday and its movements can be confidently crossed out and forgotten. The fact is that the previous day's movements have no effect on the general picture. If we witnessed a correction, then the pair should fall today. If the uptrend is not over, then the market will find a reason to buy further. It is safe to assume that the euro's fate might be decided in the next couple of days, or even weeks. Overall, I still believe that the pair is extremely overbought and should not be so high.
Speaking of trading signals, there were practically none on Tuesday, which may be for the best. A buy signal was formed around 1.0926 overnight, and by the time the European trading session opened, the price remained at the level of the formation point. Therefore, it was safe to open a long position. Until the very evening, no other signals were formed, so longs had to be closed manually. With them, you could earn about 25 points. A little, but better than nothing.
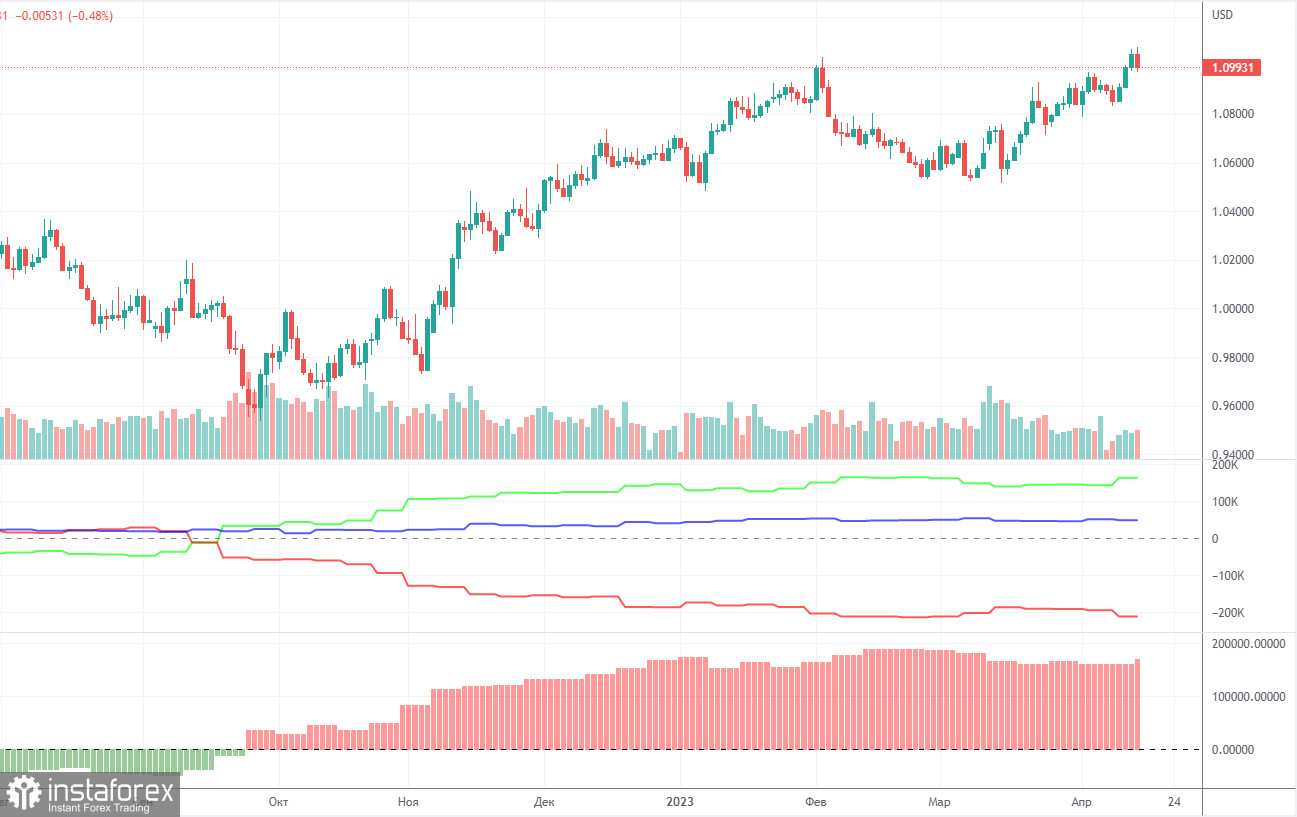
On Friday, a new COT report for April 11 was released. The CFTC has caught up with the lost time and is now publishing reports that correspond to the current time period. Over the past 6-7 months, the picture has fully corresponded to what is happening in the market. In the picture above, it is clear that the net position of large players (second indicator) has been growing since the beginning of September 2022. Around the same time, the European currency began to strengthen. At the moment, the net position of non-commercial traders remains "bullish" and very high, just like the forex rate of the European currency, which cannot even properly correct downwards. We have already drawn traders' attention to the fact that a fairly high "net position" reading indicates that the uptrend is about to complete soon. This is signaled by the first indicator, where the red and green lines have moved far away from each other, which often precedes the end of the trend. The European currency has tried to reverse downwards, but so far we have only seen a minor pullback downwards. During the last reporting week, the number of long positions among the non-commercial group increased by 18,700, while the number of short contracts fell by 1,200. Accordingly, the net position has increased significantly. The number of long positions is higher than the number of shorts among non-commercial traders by 164,000. A correction is still on the horizon, so even without COT reports, it is clear that EUR/USD should resume its decline.
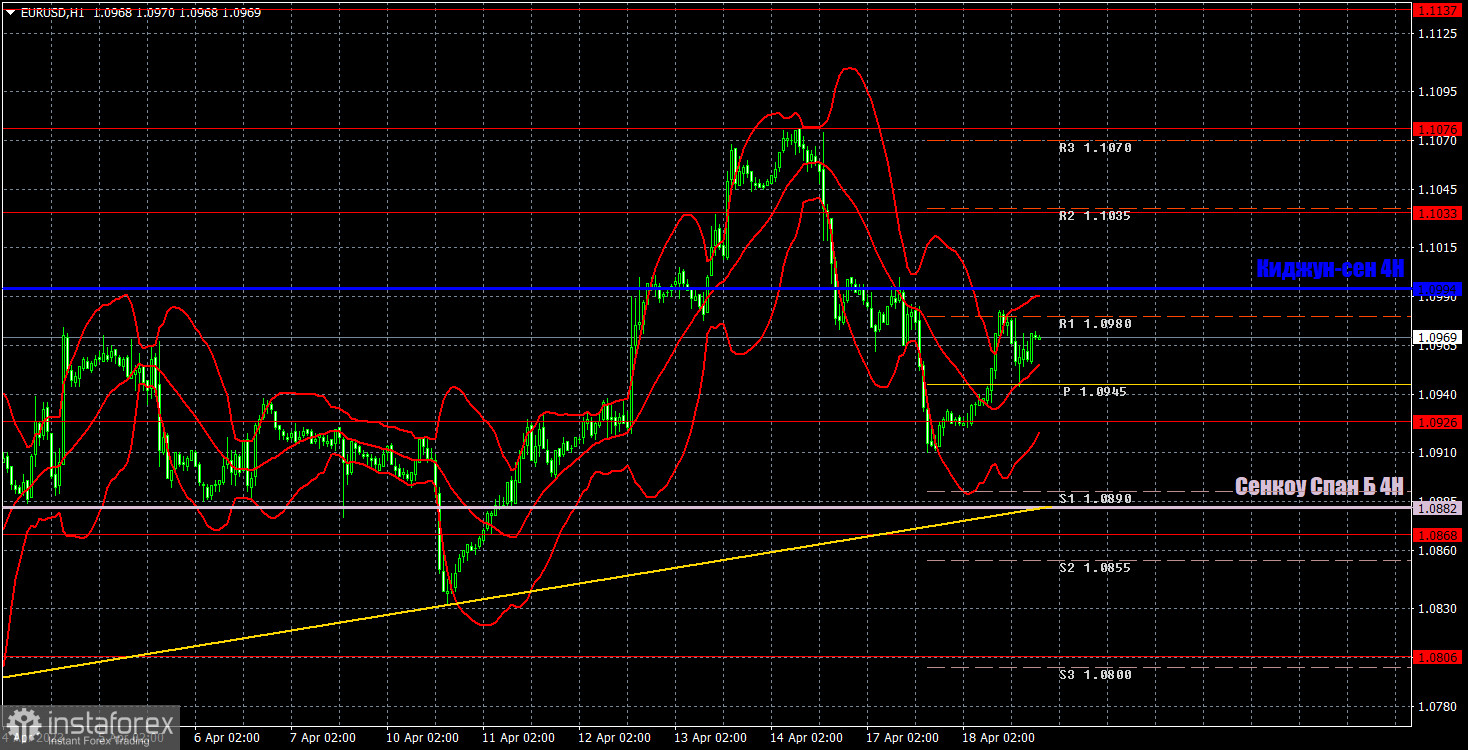
On the hourly chart, the pair maintains an uptrend, as shown by the fact that it is staying above the trend line and above all lines of the Ichimoku indicator. Even despite a fairly strong pullback on Friday and Monday, nothing has changed technically so far. The dollar still finds it difficult to rise, which is very strange and surprising, since there isn't any good reason for the euro to rise. For Wednesday, we highlight the following trading levels - 1.0658-1.0669, 1.0762, 1.0806, 1.0868, 1.0926, 1.1033, 1.1076, 1.1137-1.1185, 1.1234, 1.1274, as well as Senkou Span B (1.0882) and Kijun-sen (1.0994) lines. Ichimoku indicator lines can move intraday, which should be taken into account when determining trading signals. There are also support and resistance although no signals are made near these levels. They could be made when the price either breaks or rebounds from these extreme levels. Do not forget to place Stop Loss at the breakeven point when the price goes by 15 pips in the right direction. In case of a false breakout, it could save you from possible losses. On April 19th, the final value of the consumer price index for March will be published in the European Union, which is unlikely to differ from the first estimate, and in the United States, the Federal Reserve's "Beige Book" report will be released, which is hardly interesting. I don't expect the market to react to both events. The only exception may be a situation in which the second inflation estimate differs significantly from the first (i.e., the forecast). But this rarely happens.
Resistance/support - thick red lines, near which the trend may stop. They do not make trading signals.
Kijun-sen and Senkou Span B are the Ichimoku indicator lines moved to the hourly timeframe from the 4-hour timeframe. They are also strong lines.
Extreme levels are thin red lines, from which the price used to bounce earlier. They can produce trading signals.
Yellow lines are trend lines, trend channels, and any other technical patterns.
Indicator 1 on the COT chart is the size of the net position of each trader category.
Indicator 2 on the COT chart is the size of the net position for the Non-commercial group of traders.
Dzięki analizom InstaForex zawsze będziesz na bieżące z trendami rynkowymi! Zarejestruj się w InstaForex i uzyskaj dostęp do jeszcze większej liczby bezpłatnych usług dla zyskownego handlu.

