 Anuluj
Warunki handlowe
Narzędzia


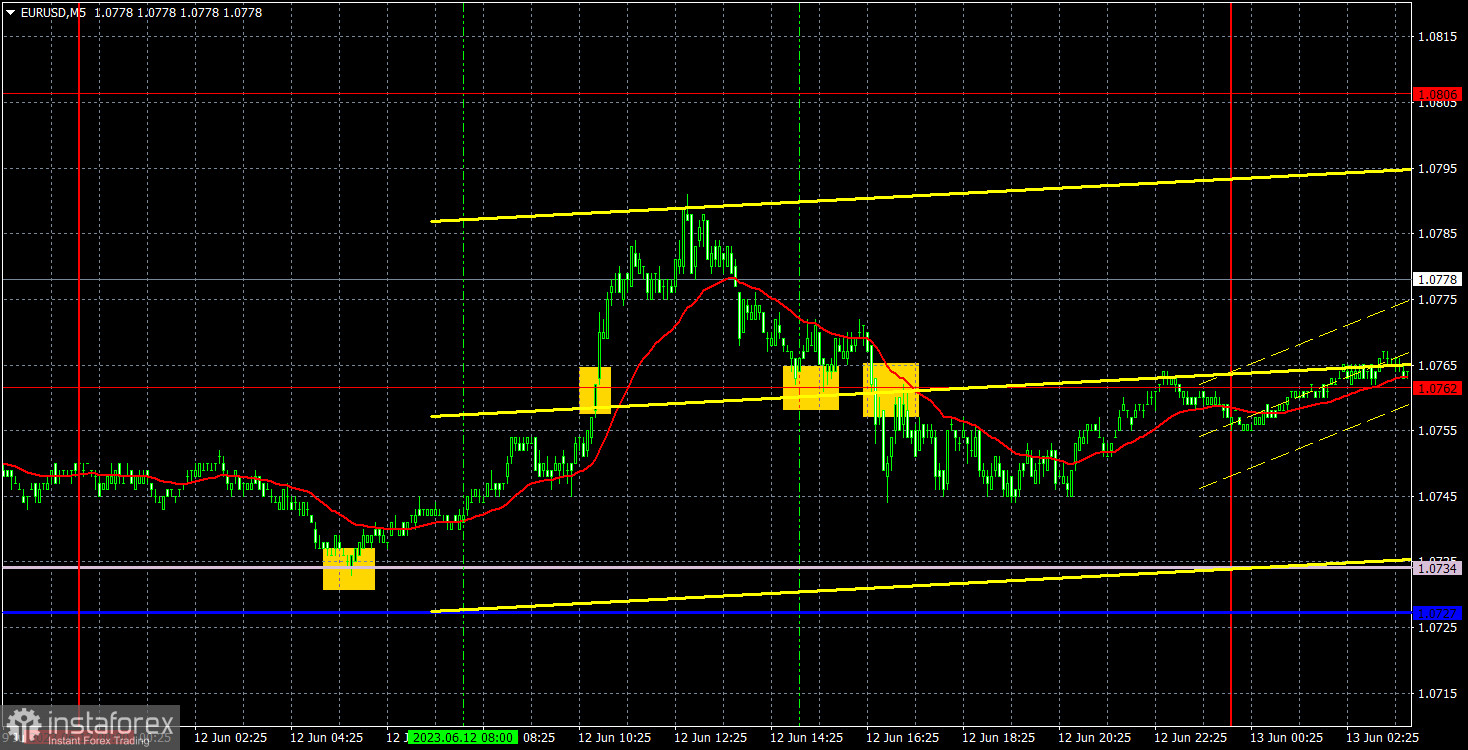
The movements of the EUR/USD pair were about 50 pips on Monday, although, based on the charts, the pair moved quite actively. However, this was merely an illusion. The actual movements were decent, but the volatility was low. There was no important news or reports on Monday. Therefore, there was nothing for traders to react to. Essentially, the sideways movement persists and has been ongoing for over two weeks. There is a slight upward slope, but the correction is very weak, which is also quite logical. This week's movements could turn out to be almost anything when the economic calendar is rich in events.
The trading signals on the 5-minute chart were very good. Overnight, the price rebounded from the Senkou Span B line, forming a buy signal, but this signal could be executed with the opening of the European trading session. Subsequently, the price reached the level of 1.0762 and surpassed it. Unfortunately, the pair could not reach the next target level and returned to 1.0762 during the US session. And later, it settled below it, forming a sell signal. At that point, it was appropriate to close long positions, with a profit of 15 pips. Short positions could also be opened based on the sell signal, which brought traders an additional 10 pips. Considering the overall volatility of the day, which was 50 pips, a profit of 25 pips is not bad.
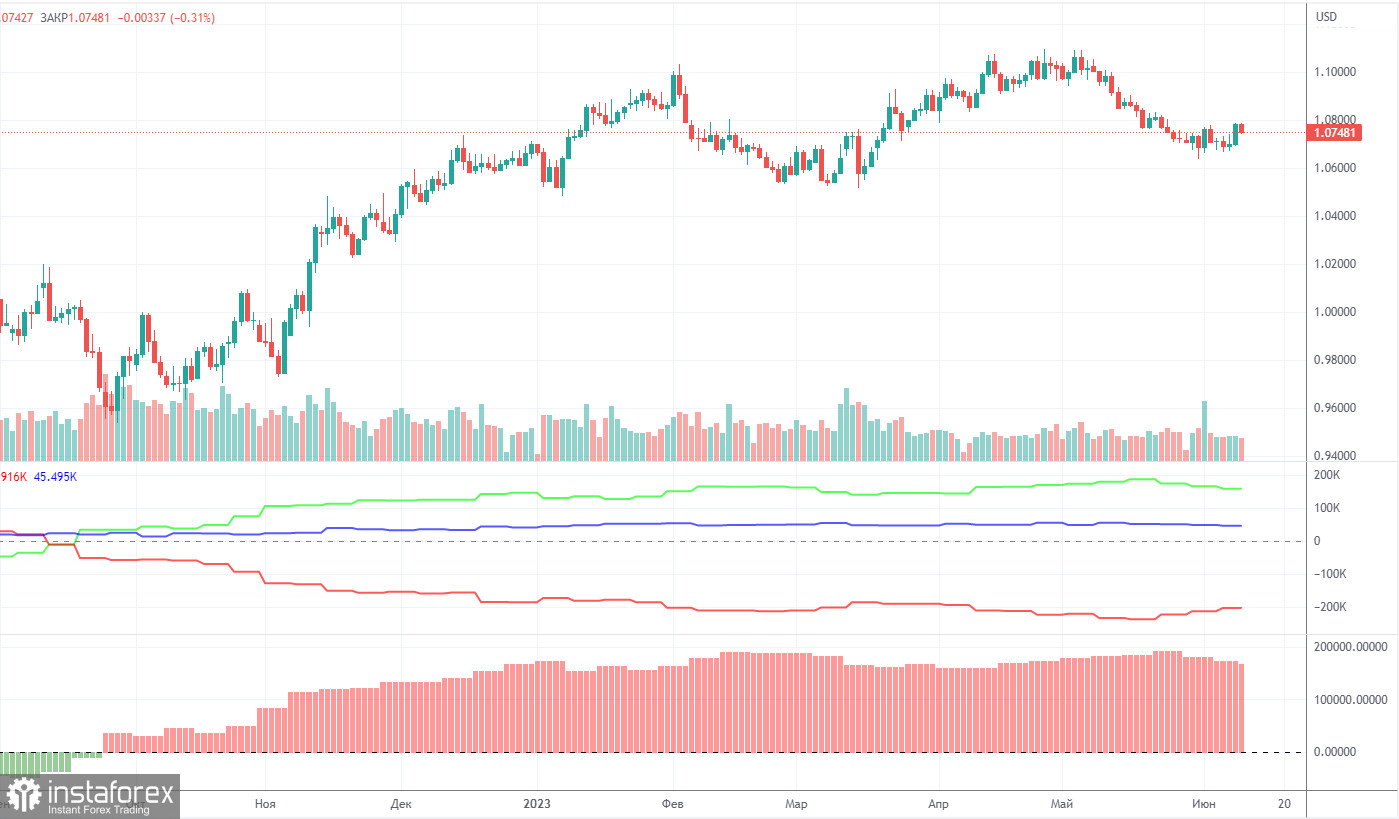
On Friday, a new COT report for June 6 was released. In the last 9 months, COT reports have fully corresponded to what is happening on the market. The chart above clearly shows that the net position of big traders (the second indicator) began to grow again in September 2022. At the same time, the euro resumed an upward movement. The net position of non-commercial traders is bullish. The euro is trading at its highs against the US dollar.
I have already mentioned that a fairly high value of the "net position" indicates the end of the uptrend. The first indicator also signals such a possibility as the red and green lines are very far from each other. It often occurs before the end of the trend. The euro tried to start falling a few months ago but there was only a pullback. During the last reporting week, the number of long positions of the "Non-commercial" group of traders decreased by 5,700 and the number of short positions rose by 1,500. The number of long positions is higher than the number of short ones. This is a very large gap. The number of long positions is 59,000 higher than short ones. The difference is more than three times. The correction has begun. Yet, it may not be a correction but the start of a new downtrend. At this time, it is clear that the pair is likely to resume a downward movement without COT reports.

In the 1-hour chart, the pair is trying to start an upward correction but there are no drivers for growth. Therefore, the downtrend may resume in the near future. However, it could hardly happen this week as traders will have to digest the results of two meetings of central banks as well as US inflation data. The movements could be strong and unpredictable. Yet, the medium-term outlook remains bearish.
On June 13, trading levels are seen at 1.0537, 1.0581, 1.0658-1.0669, 1.0762, 1.0806, 1.0868, 1.0943, 1.1092, as well as the Senkou Span B (1.0734) and Kijun-sen (1.0727) lines. Ichimoku indicator lines can move intraday, which should be taken into account when determining trading signals. There are also support and resistance although no signals are made near these levels. Signals could be made when the price either breaks or bounces from these extreme levels. Do not forget to place Stop Loss at the breakeven point when the price goes by 15 pips in the right direction. In case of a false breakout, it could save you from possible losses.
In the UK, there are no significant events lined up. But the day will still be very interesting, as Federal Reserve officials will start monetary policy deliberations on Tuesday, and the US inflation report will also be published.
Resistance/support - thick red lines, near which the trend may stop. They do not make trading signals.
Kijun-sen and Senkou Span B are the Ichimoku indicator lines moved to the hourly timeframe from the 4-hour timeframe. They are also strong lines.
Extreme levels are thin red lines, from which the price used to bounce earlier. They can produce trading signals.
Yellow lines are trend lines, trend channels, and other technical patterns.
Indicator 1 on the COT chart is the size of the net position of each trader category.
Indicator 2 on the COT chart is the size of the net position for the Non-commercial group of traders.
Dzięki analizom InstaForex zawsze będziesz na bieżące z trendami rynkowymi! Zarejestruj się w InstaForex i uzyskaj dostęp do jeszcze większej liczby bezpłatnych usług dla zyskownego handlu.

