 Anuluj
Warunki handlowe
Narzędzia


UK retail sales rose by 0.3% in May, indicating a positive trend. Compared to last year, the pace of decline has slowed from -3.0% to -1.7%. This factor supported the local growth of the British pound.
However, business activity indices for the EU, the UK and the United States were later published and had a strong impact on financial markets. Indices in the UK and the European Union were lower than expected, which led to the weakening of the pound sterling and the euro. In the United States, the indices also fell, but were slightly better than in Europe.
As a result, the U.S. dollar managed to strengthen slightly in value.
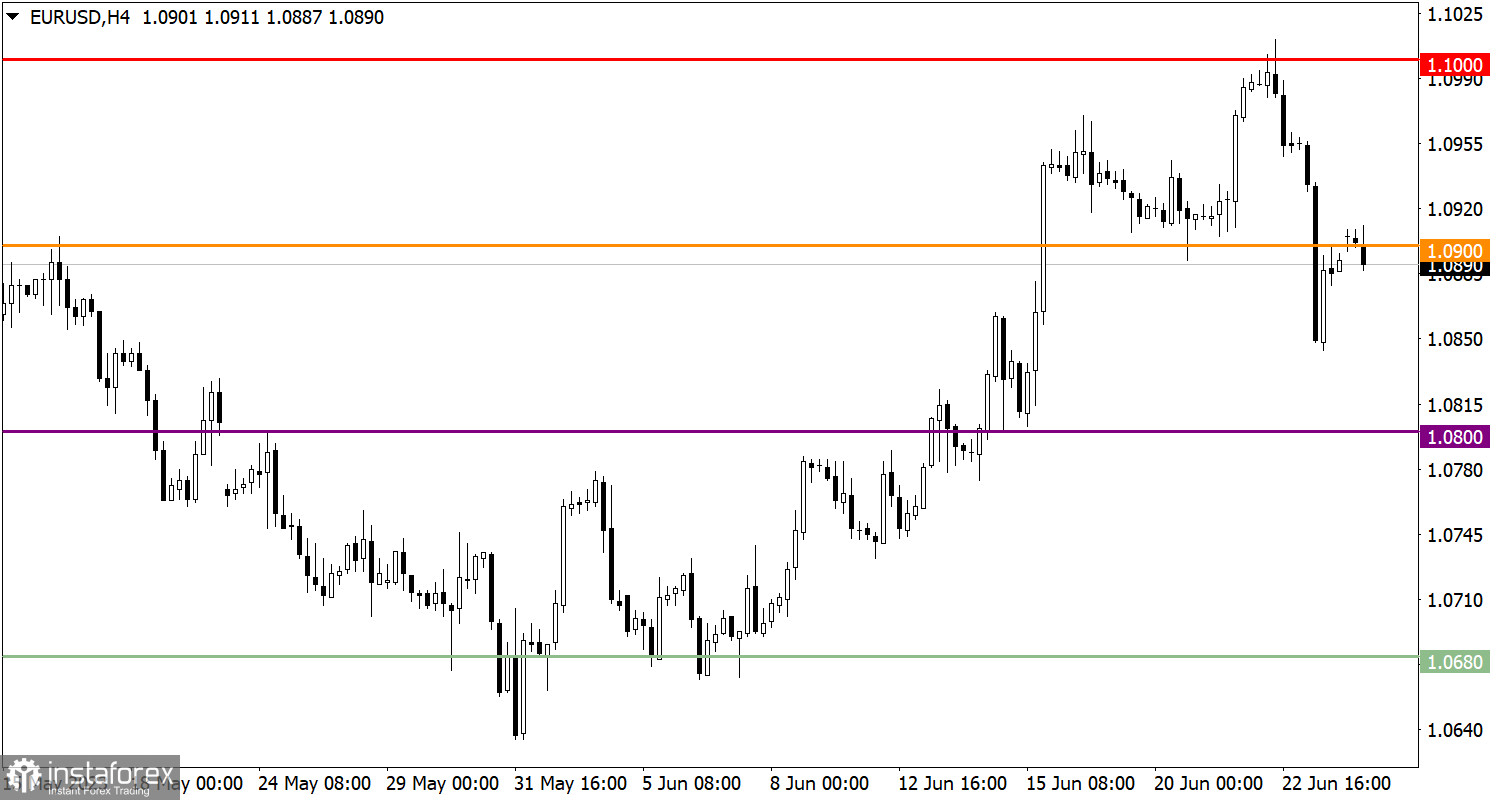
The EUR/USD currency pair started to decline after bouncing off the 1.1000 level, resulting in significant price changes, and the quote temporarily dropped below 1.0850.
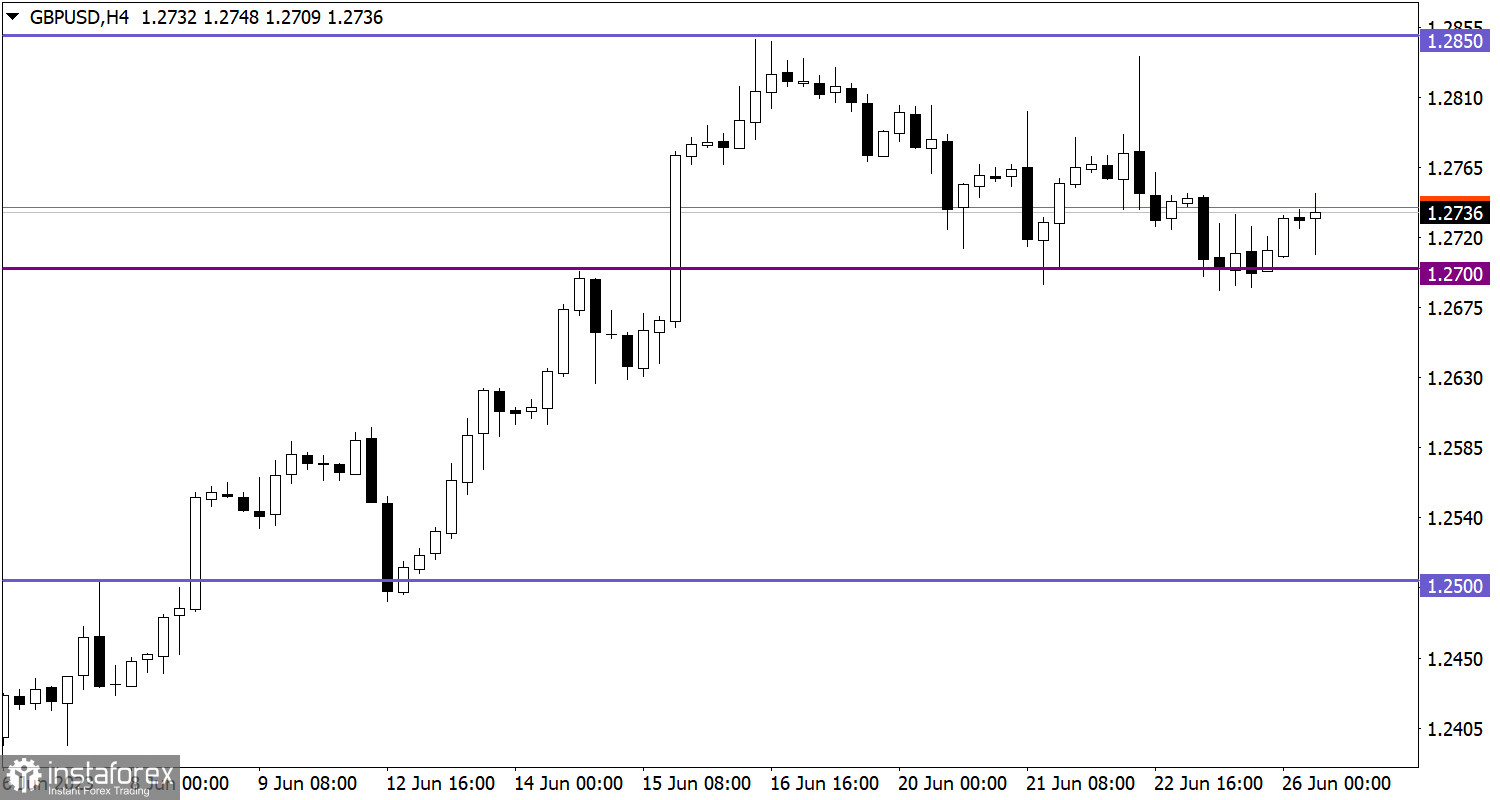
The GBP/USD pair failed to surpass the 1.2700 level after several attempts. As a result, the volume of short positions decreased, and the market is currently experiencing a stagnation.

Today, the macroeconomic calendar is empty, and the publication of important statistical data in the EU, the UK, and the United States is not expected. In such situations, market participants may pay special attention to other sources of information, such as news, statements from central bank representatives, or political events that can influence financial markets. The absence of significant statistical data can lead to more active reactions to such information and an increase in speculative activity.
A technical pullback led the euro's quote to 1.0900, resulting in partial recovery after the previous decline. A temporary stagnation around this level is possible, allowing the market to regroup. In terms of price movements, an upward scenario will be considered if the price returns above 1.0950. And a downward scenario will be relevant if the price remains below 1.0850.
If the price fails to stay below the 1.2700 level, it may lead to a rebound and recovery of the British pound's exchange rate after the previous decline. However, if the quote continues to stay below 1.2700 throughout the day, the current correction trend will continue.
The candlestick chart type is white and black graphic rectangles with lines above and below. With a detailed analysis of each individual candle, you can see its characteristics relative to a particular time frame: opening price, closing price, intraday high and low.
Horizontal levels are price coordinates, relative to which a price may stop or reverse its trajectory. In the market, these levels are called support and resistance.
Circles and rectangles are highlighted examples where the price reversed in history. This color highlighting indicates horizontal lines that may put pressure on the asset's price in the future.
The up/down arrows are landmarks of the possible price direction in the future.
Dzięki analizom InstaForex zawsze będziesz na bieżące z trendami rynkowymi! Zarejestruj się w InstaForex i uzyskaj dostęp do jeszcze większej liczby bezpłatnych usług dla zyskownego handlu.


