 Anuluj
Warunki handlowe
Narzędzia


Yesterday there were no significant macroeconomic events on the calendar, and there was also a public holiday in the United States due to the celebration of Independence Day. As a result, trading volume decreased, leading to a decline in market volatility.
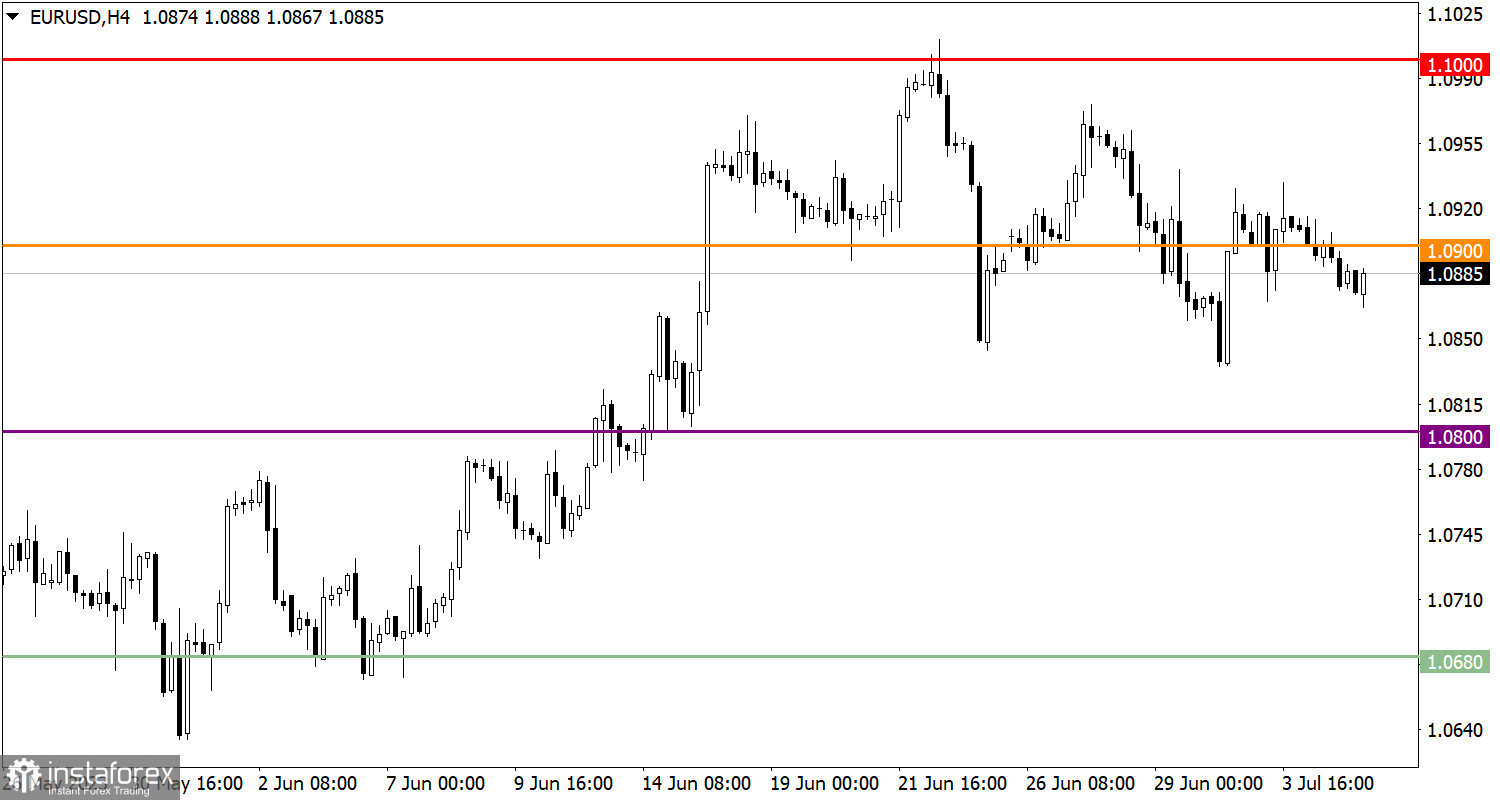
Despite the absence of the main player in the market, the EUR/USD currency pair continued to decline throughout the day. Although price changes were insignificant, they indicate a continuing corrective movement from the 1.1000 level.
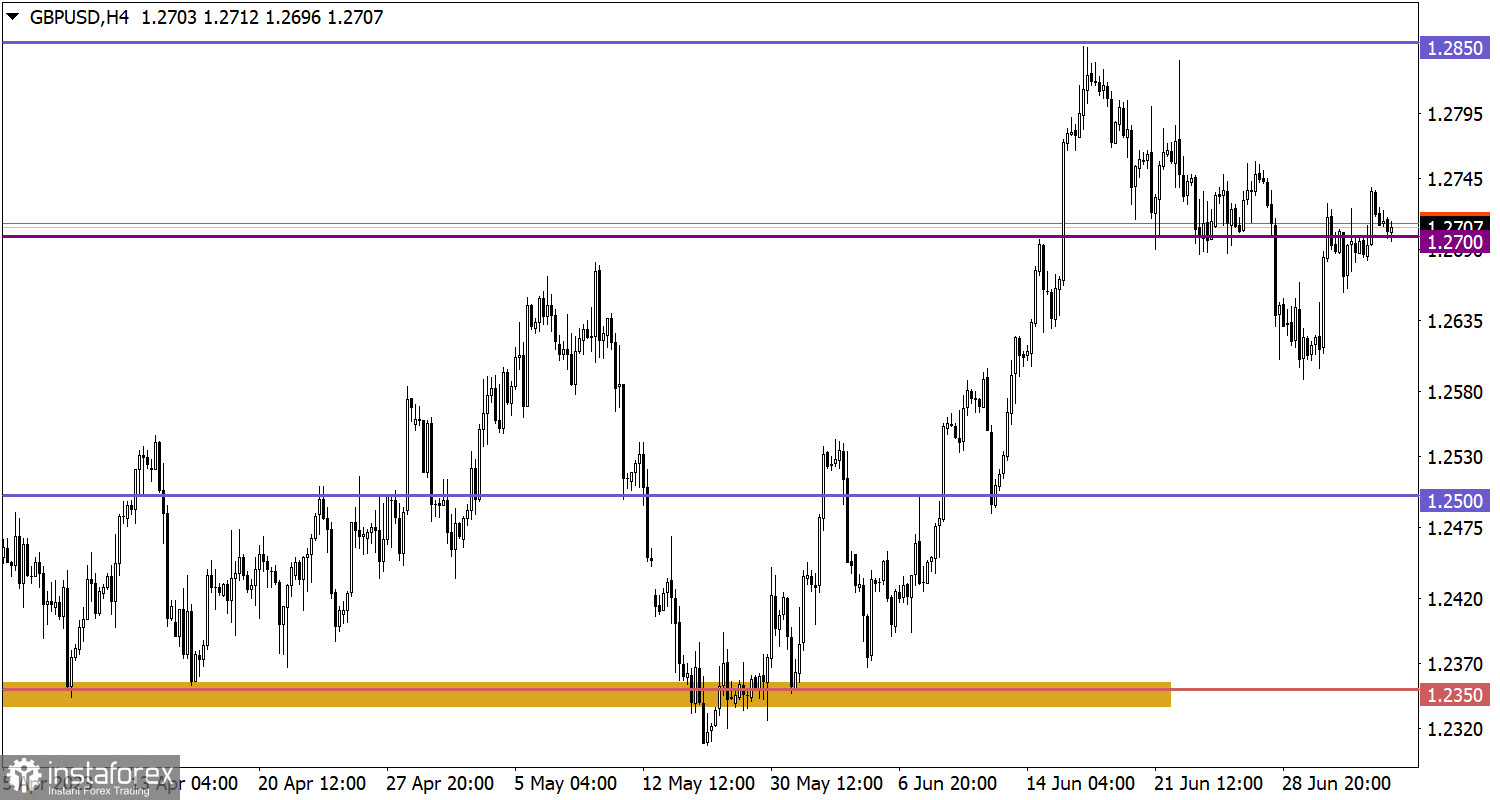
The GBP/USD pair closed with a slight increase; however, this movement did not lead to significant changes in the price. The quote is still around the 1.2700 level, indicating a temporary stagnation.

Today, the final data on business activity indices in the EU and the UK are expected to be published. If the data coincide with preliminary estimates, a minor market reaction should be expected. However, in case of significant divergence between actual data and forecasts, a speculative reaction in financial markets is possible. Such discrepancies can cause changes in traders' sentiment and affect trading decisions.
In this situation, if the price continues to hold steady below the 1.0880 level, this could signal a potential increase in the volume of short positions. In this case, the current correction may be prolonged.
However, the alternative scenario suggests a price stagnation near the 1.0900 level without a clear direction. In this case, the market may be in a consolidation phase or waiting for new signals and influential factors that could affect the future direction of the price.
In this situation, for the continuation of the growth of the volume of long positions, the quote should hold above the level of 1.2750. If this condition is met, a gradual recovery in the value of the pound sterling after the recent corrective movement may occur.
As for the downward scenario, if the price returns below 1.0650, it may lead to the activation of short positions and an update of the correction cycle's local low.
However, it is worth noting that market conditions can change, and it's important to follow current price movements and additional signals in order to make balanced decisions based on the latest information.
The candlestick chart type is white and black graphic rectangles with lines above and below. With a detailed analysis of each individual candle, you can see its characteristics relative to a particular time frame: opening price, closing price, intraday high and low.
Horizontal levels are price coordinates, relative to which a price may stop or reverse its trajectory. In the market, these levels are called support and resistance.
Circles and rectangles are highlighted examples where the price reversed in history. This color highlighting indicates horizontal lines that may put pressure on the asset's price in the future.
The up/down arrows are landmarks of the possible price direction in the future.
Dzięki analizom InstaForex zawsze będziesz na bieżące z trendami rynkowymi! Zarejestruj się w InstaForex i uzyskaj dostęp do jeszcze większej liczby bezpłatnych usług dla zyskownego handlu.


