 Anuluj
Warunki handlowe
Narzędzia


Inflation in the United Kingdom has dropped to 6.8%, but this doesn't seem to bring any joy to the Bank of England. The fact remains that inflation is the highest among the major developed economies, and the slowing of this inflation was less significant than expected.
In the Eurozone, industrial production in June 2023 rose by 0.5% compared to the previous month after the revision of the previous month's figure, which also turned out to be higher than expected market forecasts.
Industrial production in the United States also showed positive dynamics, increasing by 1% compared to the previous month, which was the highest value in the last six months, and this exceeded market expectations for growth of 0.3%.
However, the main catalyst for strengthening the dollar's position was the publication of the July minutes of the Federal Reserve's meeting. The minutes showed a broad consensus on raising the rate by 25 basis points, and it is important to note that officials expressed concern about the risks of rising inflation, which may require additional monetary tightening measures. In other words, there is a possibility of further rate hikes.
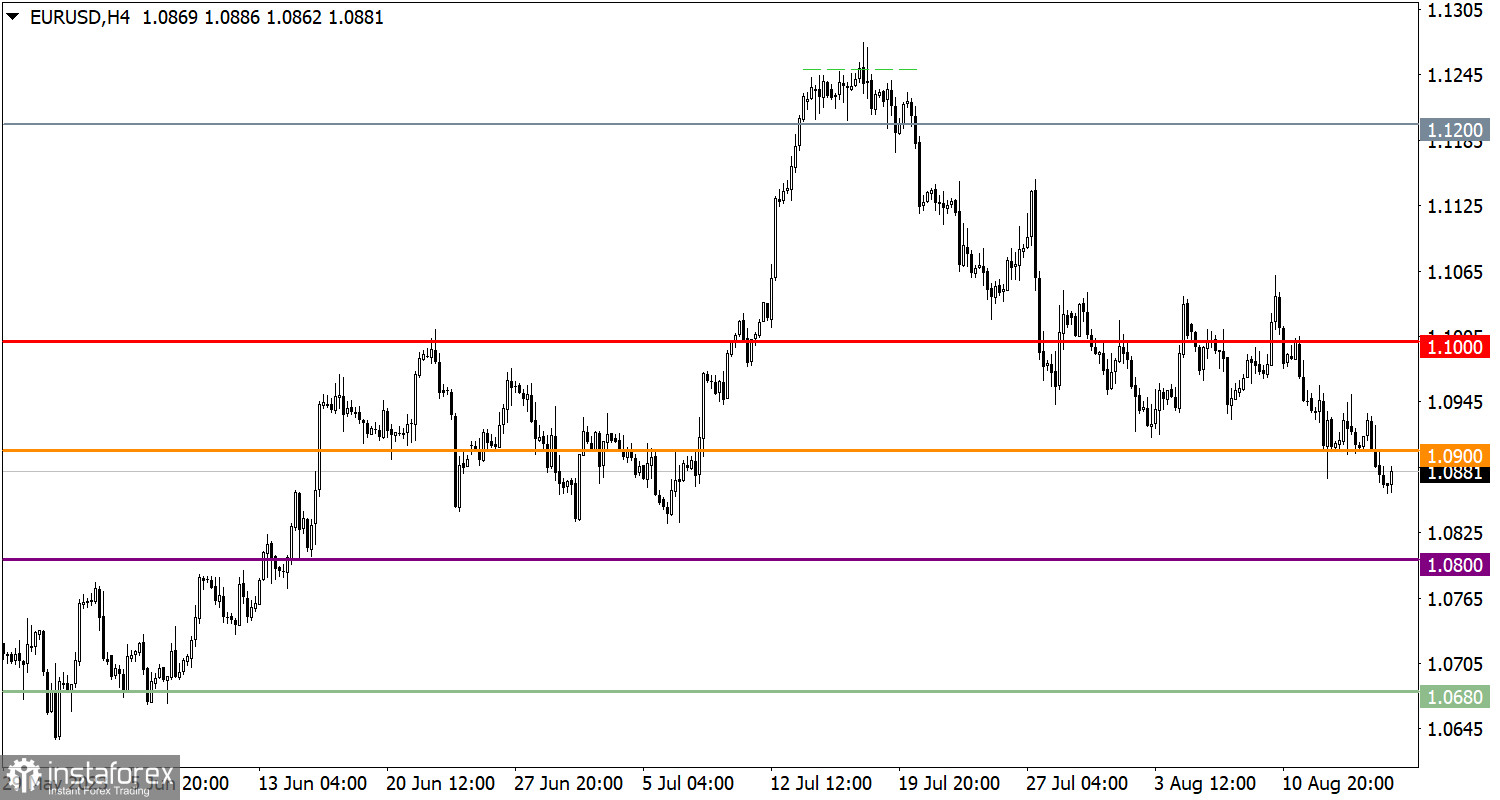
The EUR/USD exchange rate broke through the 1.0900 support level during the inertial movement. As a result, there was an increase in short positions, leading to an extension of the correction cycle.
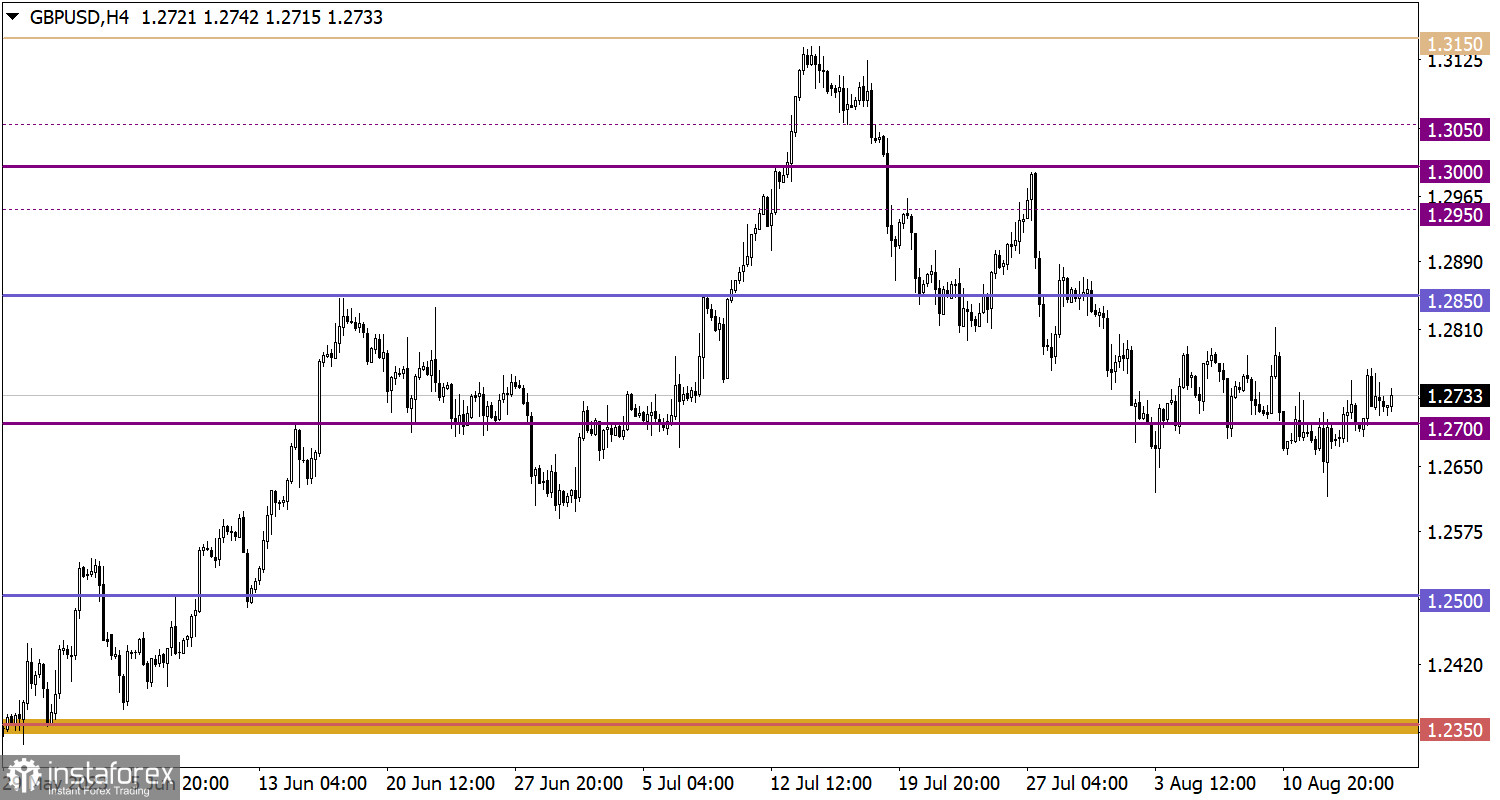
There was a slight decrease in the value of GBP/USD, but no significant or sharp changes occurred. The exchange rate remains in a fairly wide sideways range around the main point of the current correction cycle.

Today, data on jobless claims in the U.S. is expected, where an increase in the overall index is predicted. The details of the statistical data indicate that the volume of continuing claims for benefits may rise from 1.684 million to 1.7 million, while the volume of initial claims for benefits may slightly decline from 248,000 to 240,000.
Timing targeting:
U.S. Jobless claims – 12:30 UTC
Considering the significant weakening of the euro, it can be assumed that a technical signal of oversold conditions may arise in the near term. As potential support on the sellers' path, the price range between 1.0800 and 1.0850 is being considered.
For further expansion of short positions, it is necessary to keep the price below 1.2650. In this case, we are likely to see a continuation of the current correction cycle. As for the alternative scenario, it is already being realized in the market in the form of movement in the range of 1.2650/1.2800.
The candlestick chart type is white and black graphic rectangles with lines above and below. With a detailed analysis of each individual candle, you can see its characteristics relative to a particular time frame: opening price, closing price, intraday high and low.
Horizontal levels are price coordinates, relative to which a price may stop or reverse its trajectory. In the market, these levels are called support and resistance.
Circles and rectangles are highlighted examples where the price reversed in history. This color highlighting indicates horizontal lines that may put pressure on the asset's price in the future.
The up/down arrows are landmarks of the possible price direction in the future.
Dzięki analizom InstaForex zawsze będziesz na bieżące z trendami rynkowymi! Zarejestruj się w InstaForex i uzyskaj dostęp do jeszcze większej liczby bezpłatnych usług dla zyskownego handlu.


