 Anuluj
Warunki handlowe
Narzędzia


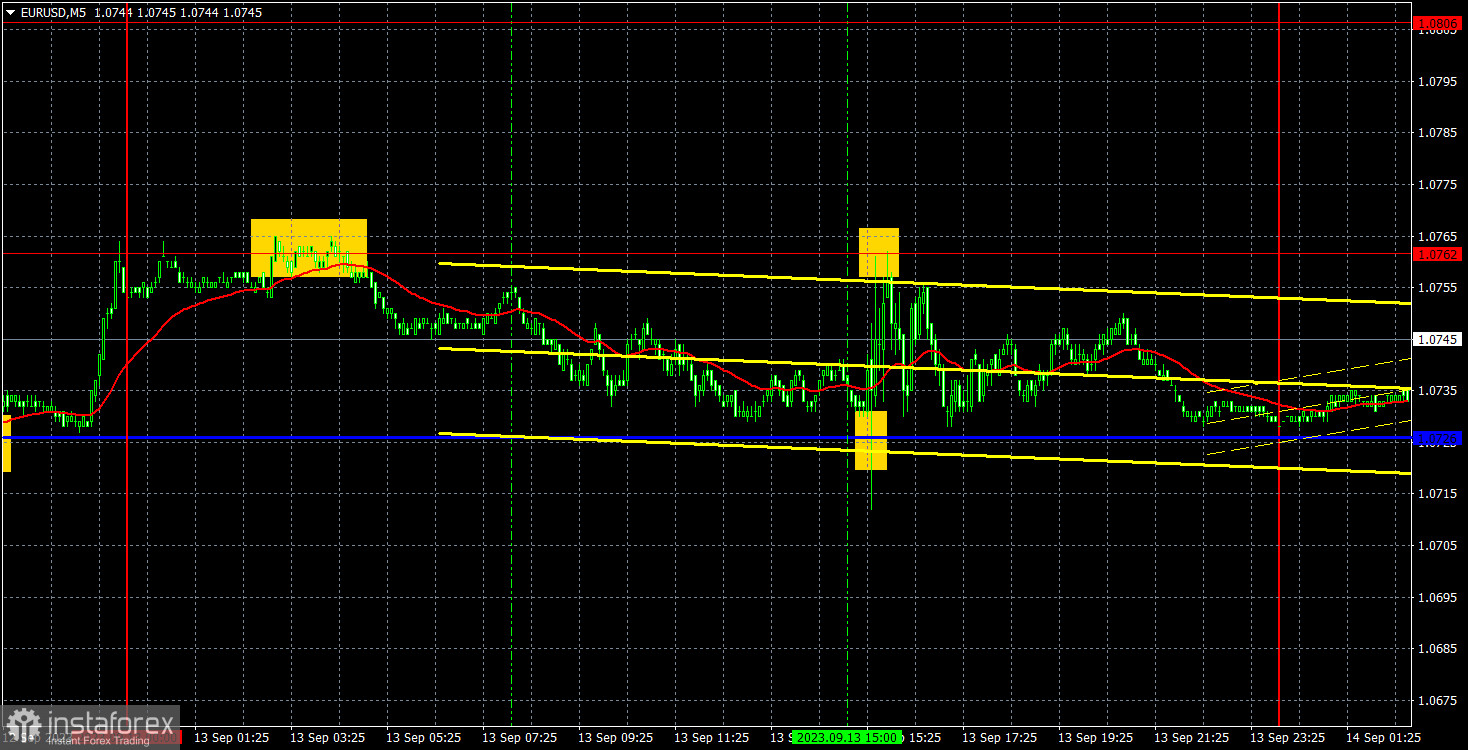
On Wednesday, EURUSD continued to trade erratically amid low volatility. It remained low regardless of the crucial US inflation data. In fact, volatility actually fell, even though it was already quite low to begin with. It is difficult to interpret the US CPI data, although inflation grew for the second consecutive month, the core inflation has decreased in line with expectations. Therefore, we initially saw the dollar rise, then fall, and then it returned to its initial position. And all of this within a 50-pip volatility range. In general, it was quite disappointing. The euro is no longer correcting; it is simply moving sideways in a flat trend, with all the resulting consequences. Even a strong macroeconomic background isn't helping.
So what can we deduce from the trading signals? The price spent the entire day between the levels of 1.0726 and 1.0762, with a distance of 36 pips between them. It is up to you whether it was worth opening positions with a potential profit of only 10-15 pips. Nevertheless, the first sell signal formed overnight, and by the opening of the European session, the price hardly moved away from the point of formation. Then, over the course of 5-6 hours, the price steadily moved down by 30 pips, but it was advisable to manually close all trades before the inflation report was published or set Stop Loss orders to break even. The next two signals formed precisely during release of the inflation report, so they should not have been executed. As a result, traders could have made 20 pips at best yesterday.
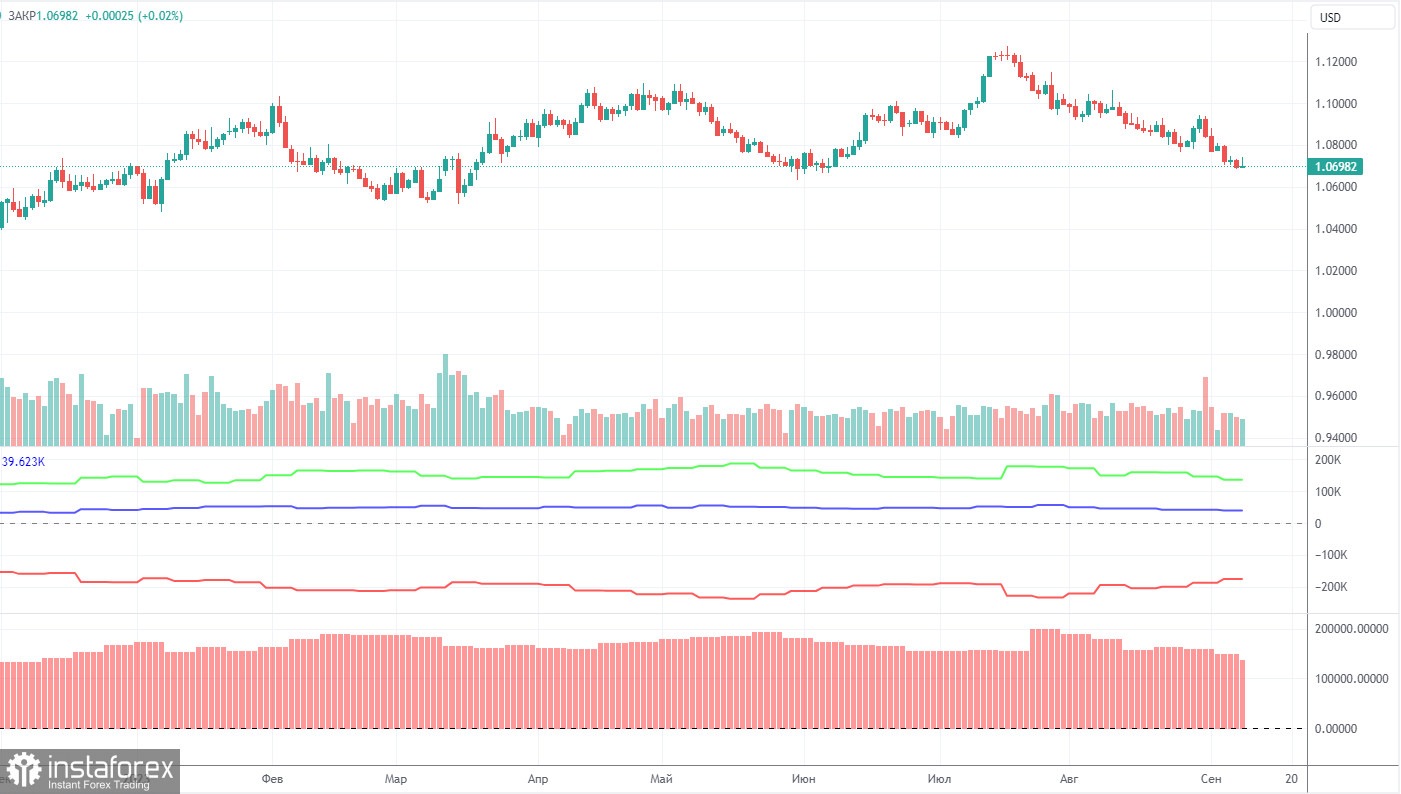
On Friday, a new COT report for September 5 was released. Over the last 12 months, COT reports fully corresponded to what is happening in the market. The chart above clearly shows that the net position of major traders (the second indicator) began to grow in September 2022 and at about the same time the euro started rising too. In the last 6-7 months, the net position has not risen but the euro remains at very high levels and is declining rather slowly. At the moment, the net position of non-commercial traders is bullish and remains strong. The euro continues to stay relatively expensive compared to the dollar.
I have already mentioned the fact that a fairly high value of the net position signals the end of an uptrend. This is also confirmed by the first indicator where the red and green lines are very far from each other. Usually, it precedes the end of the trend. During the last reporting week, the number of long positions of the non-commercial group of traders increased by 5,200 and the number of short ones rose by 15,600. The net position decreased by 10,400 contracts. The number of long positions is higher than the number of short ones of non-commercial traders by 136,000. This is a very large gap. Even without COT reports, it is obvious that the euro should decline.
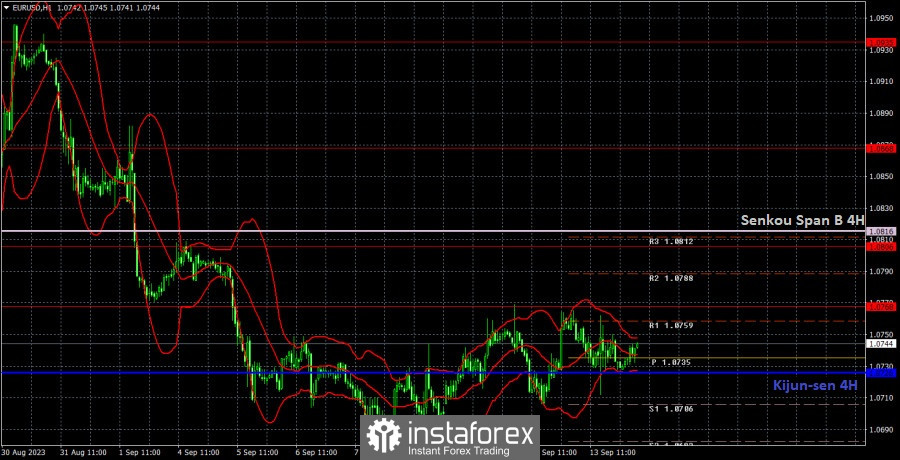
On the 1H chart, the downtrend persists, and the pair is trying to correct higher, but it still doesn't have any good reason to start an uptrend. The euro can resume its downward movement, which is logical in the medium term. Today, we still have to get through the European Central Bank meeting, so there's a possibility of continuing the bullish correction.
On September 14, traders should pay attention to the following key levels: 1.0537, 1.0581, 1.0658-1.0669, 1.0768, 1.0806, 1.0868, 1.0935, 1.1043, 1.1092, as well as the Senkou Span B (1.0816) and Kijun-sen (1.0726) lines. The lines of the Ichimoku indicator can move during the day, which should be taken into account when determining trading signals. There are support and resistance levels that can be used to lock in profits. Traders look for signals at rebounds and breakouts. It is recommended to set the Stop Loss orders at the breakeven level when the price moves in the right direction by 15 pips. This will protect against possible losses if the signal turns out to be false.
On Thursday, the ECB will announce the results of its meeting, along with a press conference by ECB President Christine Lagarde. These are the two most important events. It is quite possible that the results of the meeting and the ECB's rhetoric will disappoint traders, and we will see the same movements. The US will release three secondary reports, which are unlikely to significantly move market sentiment.
Support and resistance levels are thick red lines near which the trend may end. They do not provide trading signals;
The Kijun-sen and Senkou Span B lines are the lines of the Ichimoku indicator, plotted to the 1H timeframe from the 4H one. They provide trading signals;
Extreme levels are thin red lines from which the price bounced earlier. They provide trading signals;
Yellow lines are trend lines, trend channels, and any other technical patterns;
Indicator 1 on the COT charts is the net position size for each category of traders;
Indicator 2 on the COT charts is the net position size for the Non-commercial group.
Dzięki analizom InstaForex zawsze będziesz na bieżące z trendami rynkowymi! Zarejestruj się w InstaForex i uzyskaj dostęp do jeszcze większej liczby bezpłatnych usług dla zyskownego handlu.


