 Anuluj
Warunki handlowe
Narzędzia


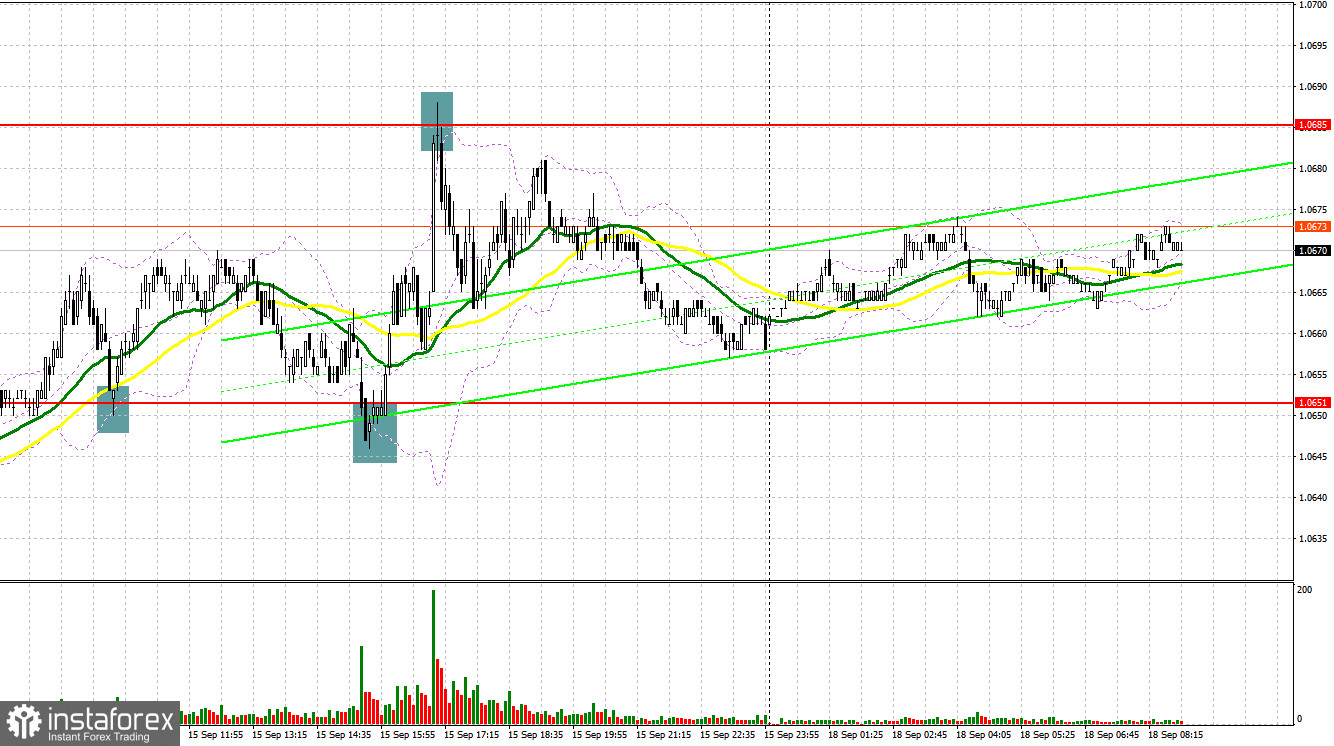
Last Friday, the pair formed several entry signals. Let's have a look at the 5-minute chart and see what happened there. In my morning review, I mentioned the level of 1.0674 as a possible entry point. The euro did move upwards but failed to test the 1.0674 level. In the afternoon, a false breakout at 1.0651 generated a nice entry point into buy positions. As a result, the euro jumped by more than 35 pips. A failed attempt to settle above 1.0685 served as a sell signal and resulted in a 20-pip decline.
For long positions on EUR/USD
A pivotal event of this week will be the US Federal Reserve meeting, where a potential rate hike is anticipated as a countermeasure against high inflation. If so, risk assets might face increased pressure, potentially strengthening the US dollar against the euro. Until then, EUR/USD might stay in a sideways channel, attempting to break out of it and establish an upward correction.
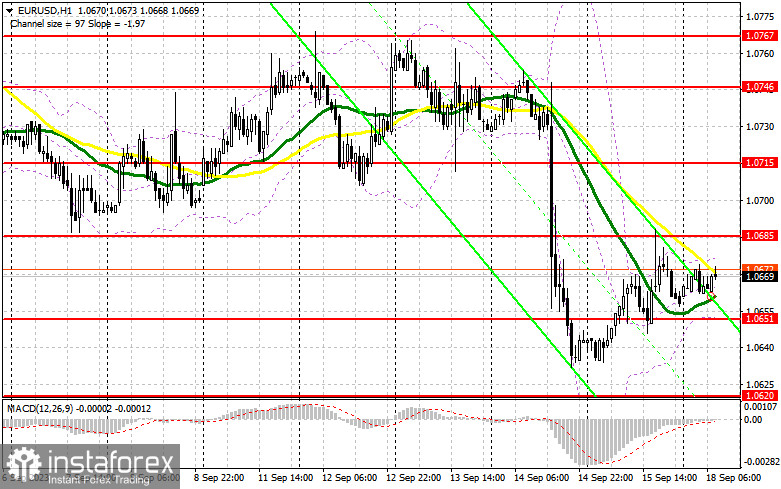
In the first half of the day, remarks are anticipated from ECB representatives, including ECB Vice President Luis de Guindos and ECB members Frank Elderson and Fabio Panetta. Their statements are unlikely to provide much support to the European currency. So, I plan to trade against the bearish trend using a dip near the immediate support at 1.0651. A false breakout here would create an entry point into long positions, targeting an upward correction, with a potential to retest the 1.0651 resistance. A breakout and a downward test of this range will boost the demand for the euro, possibly driving it to 1.0715. The most distant target will be the 1.0746 area, where I intend to lock in profits. If EUR/USD declines and shows no activity at 1.0651 - a possibility given the ongoing bear market - it is advisable to refrain from immediate buying. In such a scenario, only a false breakout around 1.0620 would signal a market entry. I would open long positions directly on a rebound from 1.0588, aiming for an upward daily correction of 30-35 pips.
For short positions on EUR/USD
Sellers retain their grip on the market, and their immediate aim is to defend the nearby resistance at 1.0685. Slightly below this level, the moving averages are found. A false breakout here would provide a good entry point for selling the pair, targeting a dip to 1.0651. Only after breaking below this range and settling there, as well as completing an upward retest, do I expect another sell signal with the target at the new monthly low of 1.0620. This is where I anticipate significant buyer activity. The ultimate target lies around 1.0588, where I am going to lock in profits. If EUR/USD ascends during the European session and bears are not present at 1.0685, buyers will have a solid chance to offset the majority of last week's decline. In this event, I will delay short positions until the price hits the new resistance at 1.0715. I would consider selling there, but only after an unsuccessful consolidation. I will open short positions directly on a rebound from the high of 1.0746, keeping in mind a downward correction of 30-35 pips.
COT report:
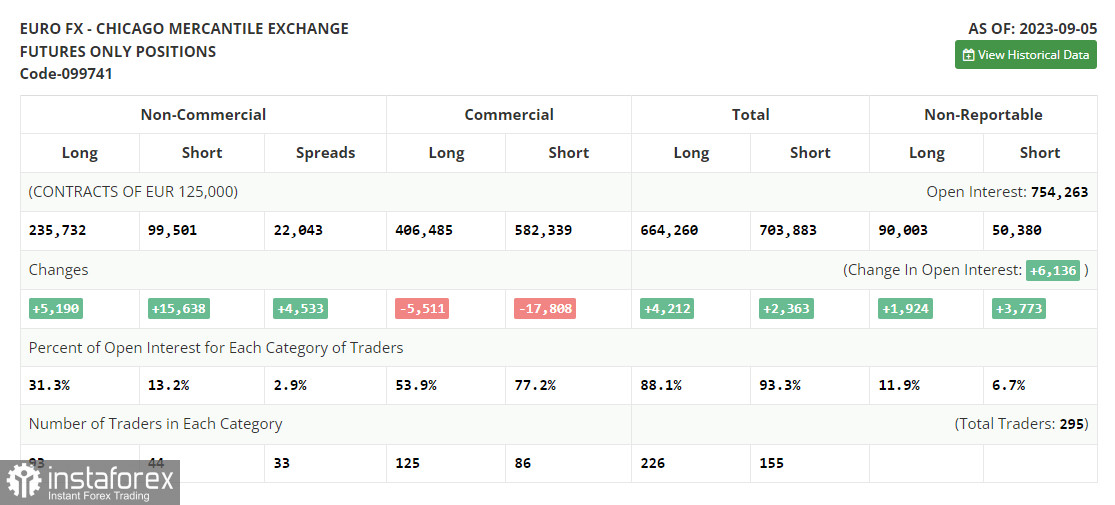
The Commitments of Traders (COT) report for September 5 displays an increase in both long and short positions. Pronounced negative shifts in the Eurozone's economic activity, coupled with downward revisions of the GDP data for the second quarter, have augmented short positions for the trading instrument. Amplifying this sentiment, statements from the Federal Reserve representatives hinting at potential rate hikes in the US explain why the US dollar is surging while the European currency is losing ground. In the immediate horizon, crucial US inflation figures are on tap, poised to influence the future course of monetary policy and affect the direction of EUR/USD. Notably, as the euro is declining, we can observe an increase in long positions, reflecting the improved appetite of risk-asset buyers at these comfortable price levels. The COT report shows that non-commercial long positions rose by 5,190 to 235,732, while non-commercial short positions surged by 15,638, reaching 99,501. Consequently, the spread between long and short positions expanded by 4,533. The closing price declined to 1.0728 from 1.0882, signaling a bearish market trend.
Indicator signals:
Moving Averages
Trading around the 30- and 50-day moving averages indicates a range-bound market.
Please note that the time period and levels of the moving averages are analyzed only for the H1 chart, which differs from the general definition of the classic daily moving averages on the D1 chart.
Bollinger Bands
If the pair declines, the lower band of the indicator at 1.0651 will act as support.
Description of indicators:
• A moving average of a 50-day period determines the current trend by smoothing volatility and noise; marked in yellow on the chart;
• A moving average of a 30-day period determines the current trend by smoothing volatility and noise; marked in green on the chart;
• MACD Indicator (Moving Average Convergence/Divergence) Fast EMA with a 12-day period; Slow EMA with a 26-day period. SMA with a 9-day period;
• Bollinger Bands: 20-day period;
• Non-commercial traders are speculators such as individual traders, hedge funds, and large institutions who use the futures market for speculative purposes and meet certain requirements;
• Long non-commercial positions represent the total number of long positions opened by non-commercial traders;
• Short non-commercial positions represent the total number of short positions opened by non-commercial traders;
• The non-commercial net position is the difference between short and long positions of non-commercial traders.
Dzięki analizom InstaForex zawsze będziesz na bieżące z trendami rynkowymi! Zarejestruj się w InstaForex i uzyskaj dostęp do jeszcze większej liczby bezpłatnych usług dla zyskownego handlu.


