 Anuluj
Warunki handlowe
Narzędzia


At the beginning of the European trading sessions, the publication of labor market data in the United Kingdom was expected. However, an unusual situation occurred when the release of unemployment data was suddenly postponed to the following week, even though wage data was published as planned. These strange actions raised doubts about the credibility of British labor market statistics. The British pound instantly began to weaken, affecting the euro exchange rate as well. However, the scale of price changes remained insignificant, possibly because the U.S. dollar still appeared to be overbought.
During the American trading session, retail sales data in the United States were published, showing an increase from 2.9% to 3.75%. It's worth noting that a decrease to 1.5% was expected. Despite the favorable macroeconomic statistics in the United States, the dollar continued to lose its positions, which might be due to the news flow related to the Palestinian-Israeli conflict.

The EUR/USD currency pair, while in the ascent phase from the support level of 1.0500, almost reached the value of 1.0600, at which point a reduction in the volume of long positions was observed.
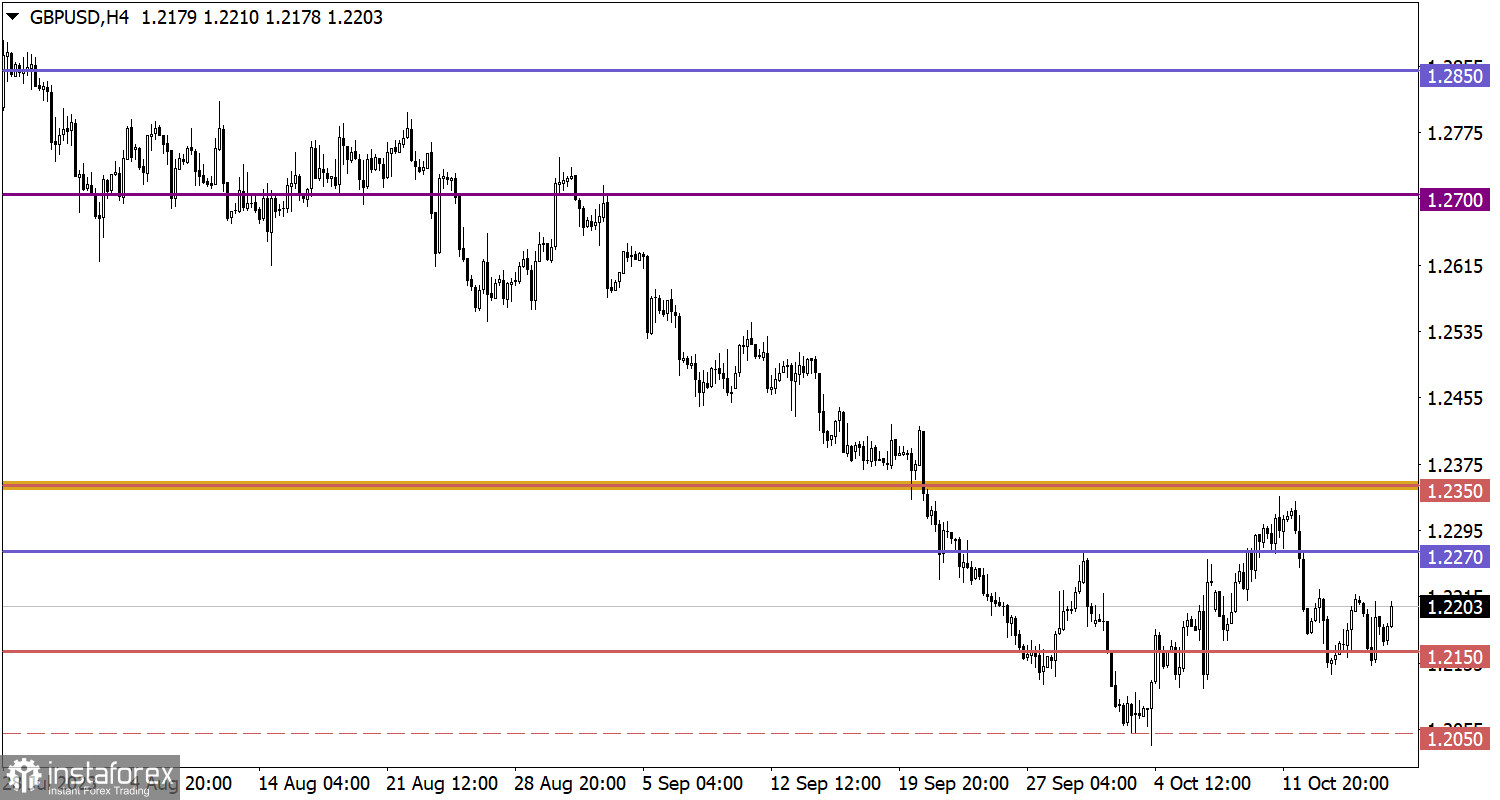
The GBP/USD currency pair formed a stagnation within 50 pips above the support level of 1.2150. There were no radical changes observed as of Tuesday.
At the opening of the European trading session, inflation data for the UK was published. The consumer price index remained at 6.7% despite expectations of a decrease to 6.6%.
Inflation data for Europe is also expected to be published, but these are final figures. If they align with the preliminary estimate, significant reactions from speculators are not to be expected.
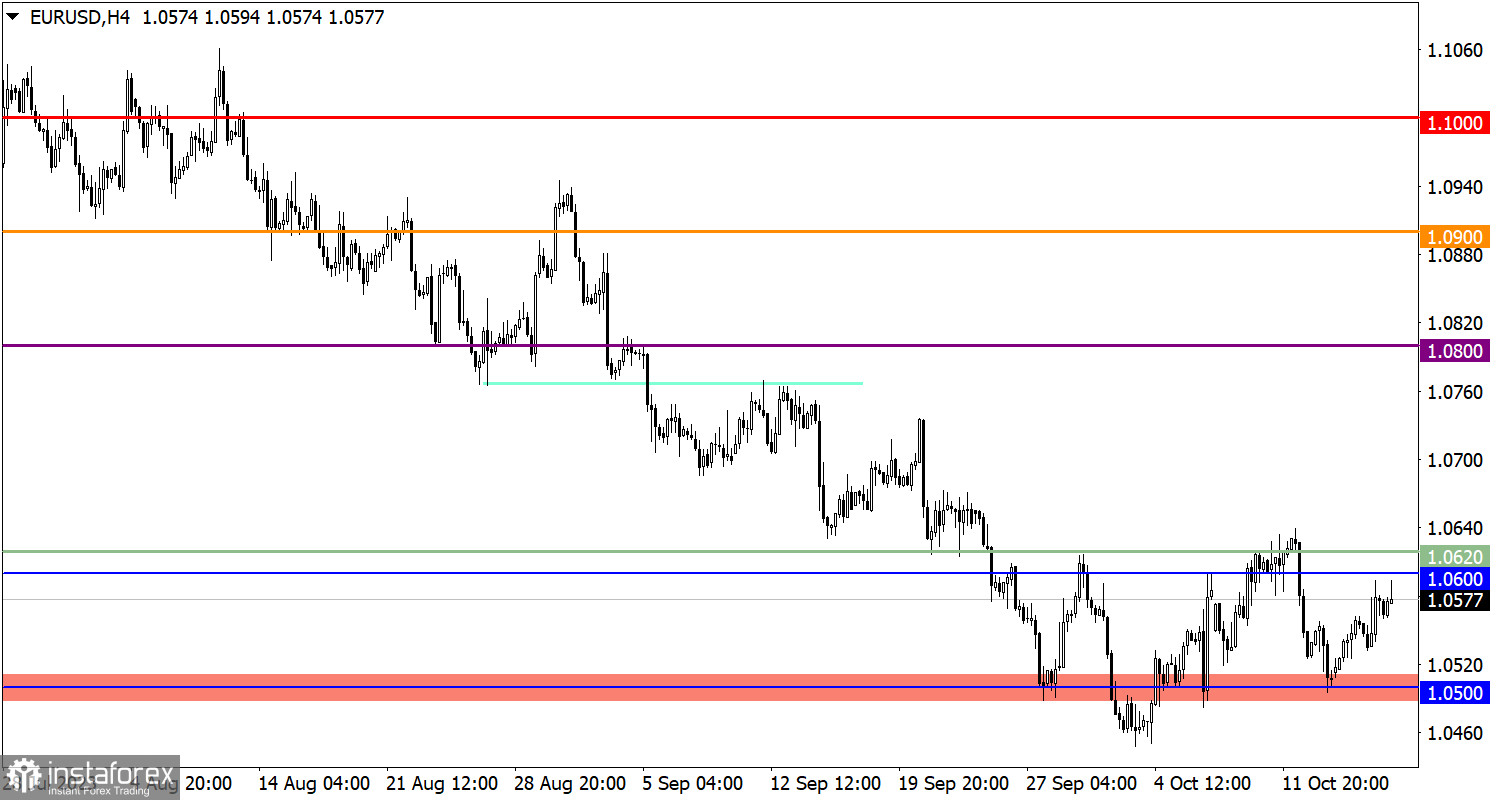
Stabilization of the price above the 1.0620 level may eventually lead to a further increase in the euro exchange rate. Until then, the 1.0600/1.0620 range serves as resistance for traders.
For further upward movement within the current pullback, it is necessary for the price to stay above the 1.2230 level. In this case, we can expect an increase in the volume of long positions towards 1.2300.
As for the downside scenario, traders will consider it if the price cannot hold above the 1.2120 level in the four-hour timeframe.
The candlestick chart type is white and black graphic rectangles with lines above and below. With a detailed analysis of each individual candle, you can see its characteristics relative to a particular time frame: opening price, closing price, intraday high and low.
Horizontal levels are price coordinates, relative to which a price may stop or reverse its trajectory. In the market, these levels are called support and resistance.
Circles and rectangles are highlighted examples where the price reversed in history. This color highlighting indicates horizontal lines that may put pressure on the asset's price in the future.
The up/down arrows are landmarks of the possible price direction in the future.
Dzięki analizom InstaForex zawsze będziesz na bieżące z trendami rynkowymi! Zarejestruj się w InstaForex i uzyskaj dostęp do jeszcze większej liczby bezpłatnych usług dla zyskownego handlu.


