 Anuluj
Warunki handlowe
Narzędzia


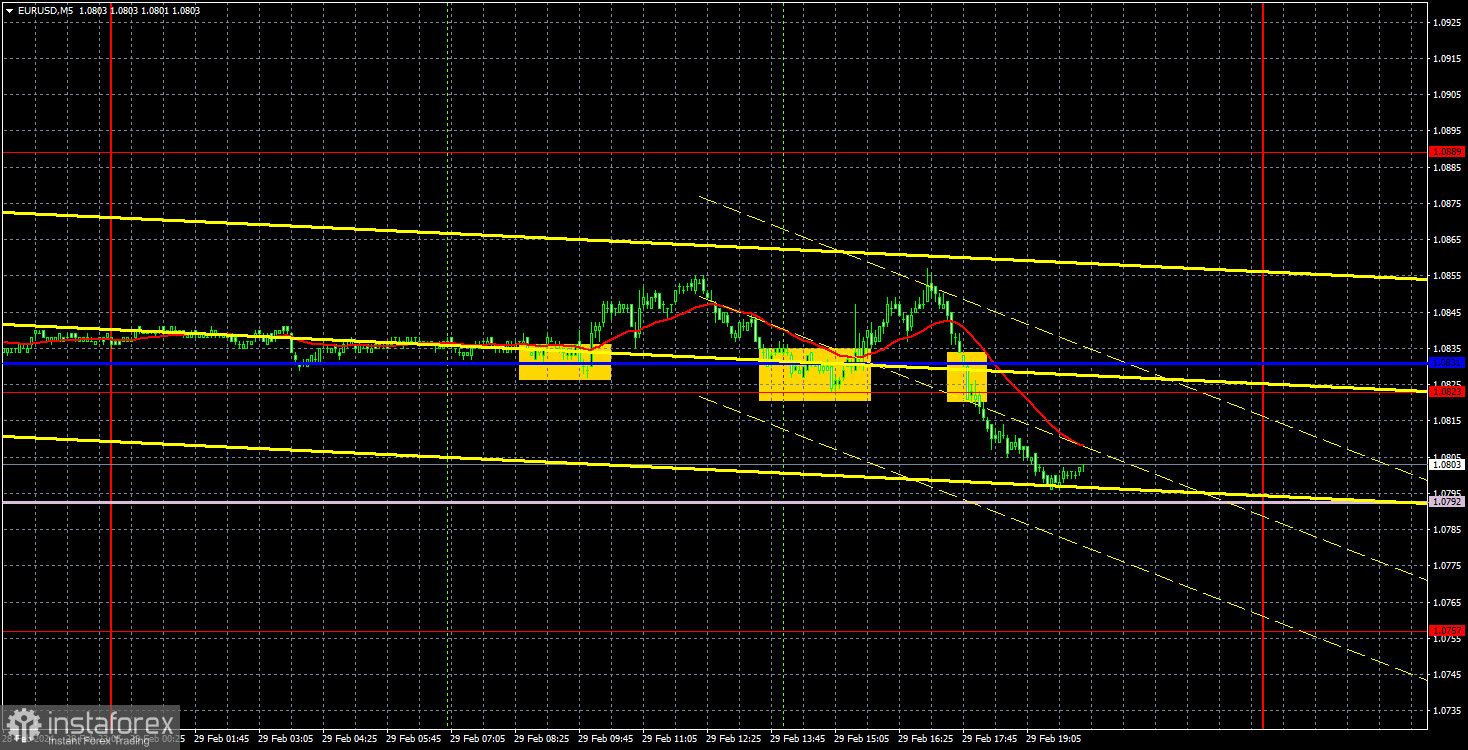
On Thursday, EUR/USD pleased us with its 60 pips movements. We have repeatedly mentioned that it doesn't make sense to enter the market with the current volatility, especially for intraday trading. In the long term, traders can afford to stay in a trade for a week or two, which will eventually bring profits. But it doesn't make much sense to trade locally right now.
Since volatility is low, almost any movement on any given day borders on the concept of a "flat" market. And in this case, we often receive weak or false signals. So even if a good signal forms, the price simply lacks the strength to reach the nearest target.
Yesterday, there were interesting and resonant reports in Germany, and the US released several reports. The market reacted to these reports. But who is interested in a reaction of 10 pips? German reports on unemployment and retail sales were disappointing. German inflation fell more than expected in February. By all accounts, the euro should have shown a fairly significant decline on Thursday. In the end, the euro did fall, but it was hardly related to the economic reports.
The US released several reports, which were also worked out by the market. In general, the market seems quite passive. Even the abundance of news and factors for movement does not lead to strong movements.
Somehow, three trading signals were formed yesterday. The price bounced twice from the area of 1.0823-1.0831, and in both cases, this pushed the euro to rise by... 15 pips each time. Therefore, if traders opened long positions based on these signals, both positions closed at breakeven. The third signal shouldn't have been executed, as the first two turned out to be false.
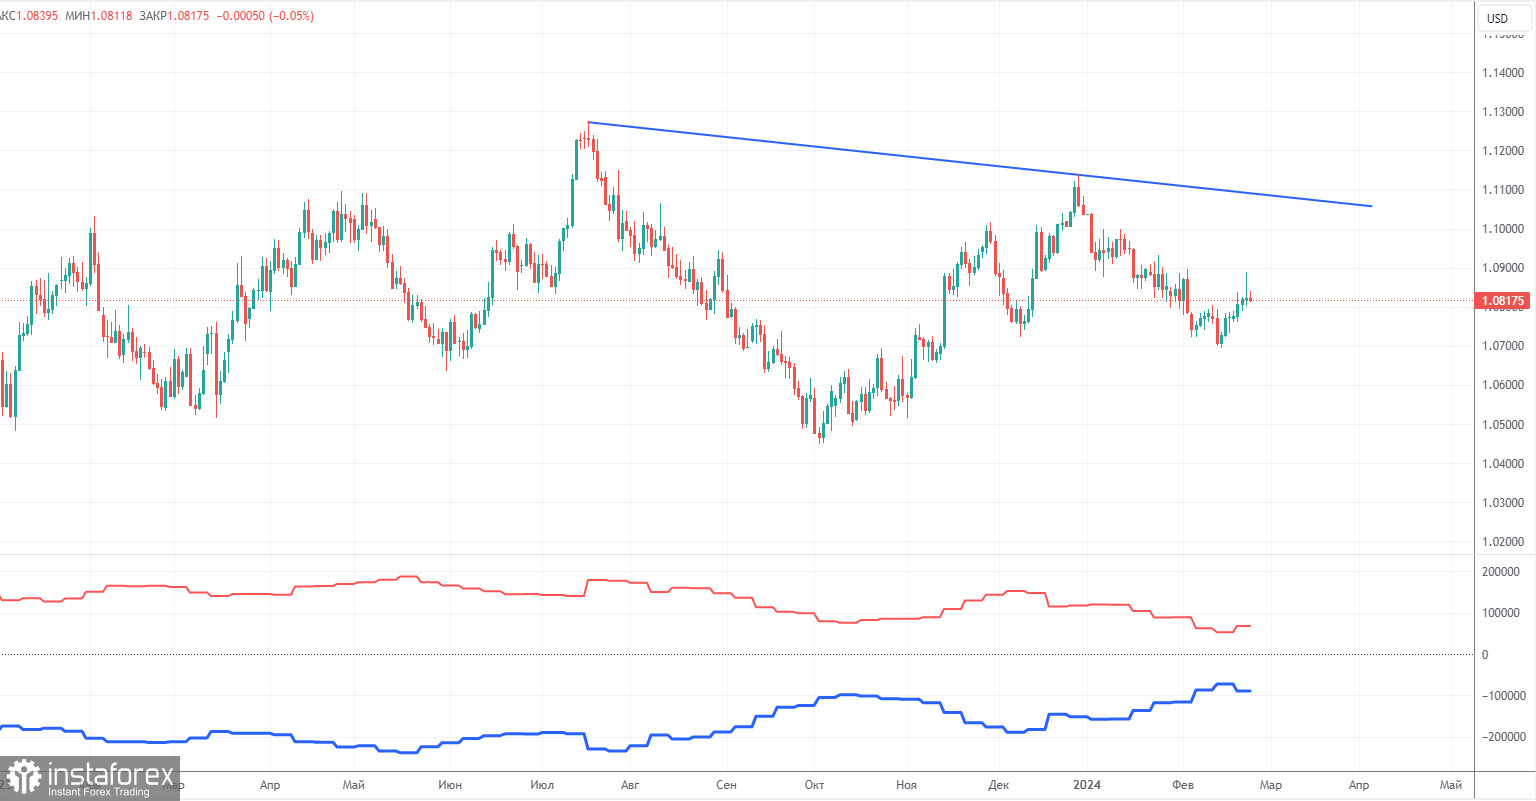
The latest COT report is dated February 20. The net position of non-commercial traders has been persistently bullish for quite some time. However, at the same time, the net position of non-commercial traders has been decreasing in recent months, while that of commercial traders has been increasing. This tells us that the mood is turning bearish, as speculators are increasing the volume of short positions on the euro. We don't see any fundamental factors that can support the euro's growth in the long term, while technical analysis also points to the formation of a downtrend.
We have already drawn your attention to the fact that the red and blue lines have significantly diverged, often preceding the end of a trend. Currently, these lines are moving towards each other (indicating a trend reversal). Therefore, we believe that the euro will fall further. During the last reporting week, the number of long positions for the non-commercial group increased by 2,300, while the number of short positions decreased by 12,800. Accordingly, the net position increased by 10,500. The number of buy contracts is still higher than the number of sell contracts among non-commercial traders by 68,000 (previously 52,000). Thus, commercial traders continue to sell the euro.
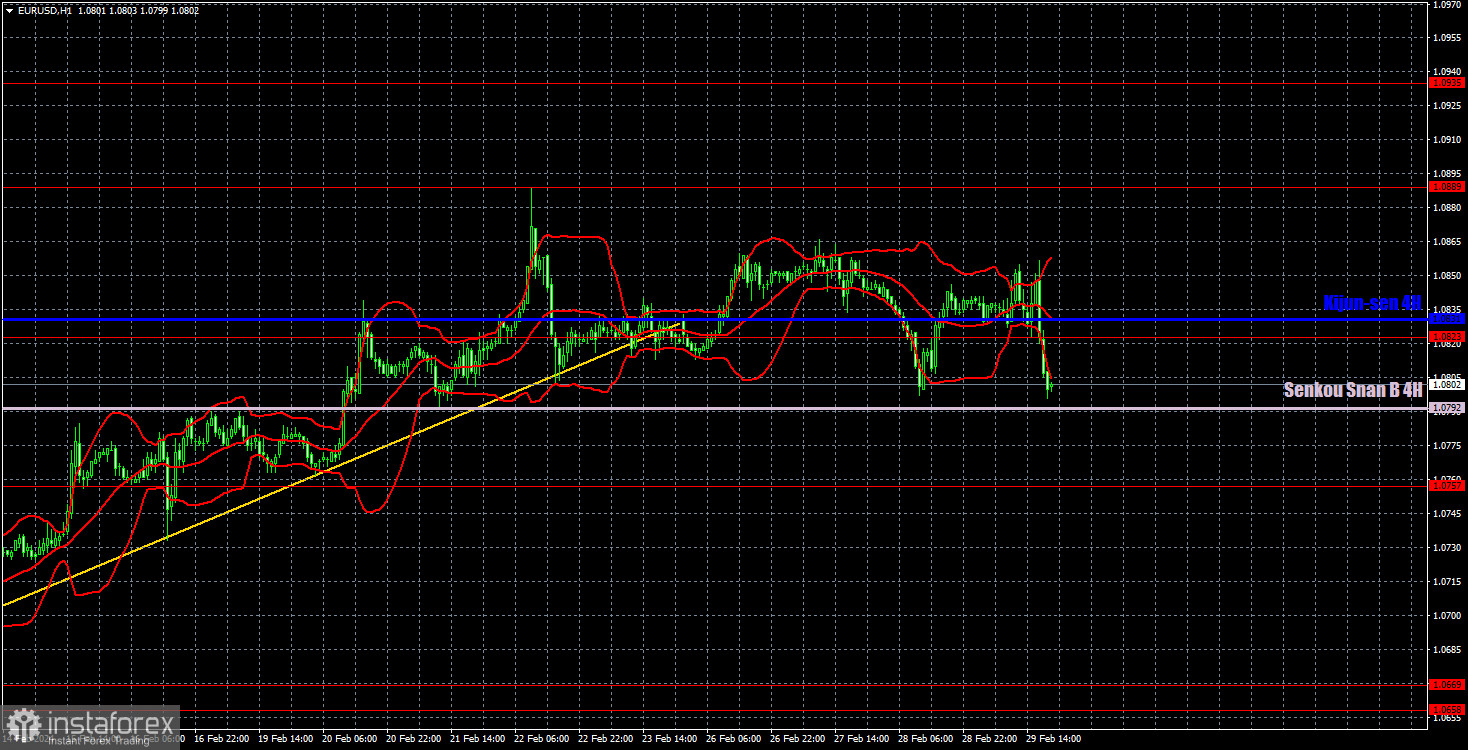
On the 1-hour chart, the uptrend remains intact, but we are skeptical about it. In our opinion, all the factors currently suggest that the dollar will strengthen. Therefore, we expect the price to consolidate below the Senkou Span B line and the euro to revive the downward movement. The nearest target is the area of 1.0658-1.0669. However, if the market continues to trade in this manner, it will take a very long time until we see any trending movement.
On March 1, we highlight the following levels for trading: 1.0530, 1.0581, 1.0658-1.0669, 1.0757, 1.0823, 1.0889, 1.0935, 1.1006, 1.1092, as well as the Senkou Span B (1.0792) and Kijun-sen (1.0831) lines. The Ichimoku indicator lines can move during the day, so this should be taken into account when identifying trading signals. Don't forget to set a Stop Loss to breakeven if the price has moved in the intended direction by 15 pips. This will protect you against potential losses if the signal turns out to be false.
Friday will bring the Manufacturing Purchasing Managers' Index of Germany and the EU's second estimates for February. Traders will look to the release of the pan-European Harmonized Index of Consumer Prices inflation for February. This report can trigger a strong market movement. The stronger the drop in inflation, the higher the probability of seeing a decline in the euro. Meanwhile, the US will release a crucial report on February's ISM Manufacturing.
Support and resistance levels are thick red lines near which the trend may end. They do not provide trading signals;
The Kijun-sen and Senkou Span B lines are the lines of the Ichimoku indicator, plotted to the 1H timeframe from the 4H one. They provide trading signals;
Extreme levels are thin red lines from which the price bounced earlier. They provide trading signals;
Yellow lines are trend lines, trend channels, and any other technical patterns;
Indicator 1 on the COT charts is the net position size for each category of traders;
Indicator 2 on the COT charts is the net position size for the Non-commercial group.
Dzięki analizom InstaForex zawsze będziesz na bieżące z trendami rynkowymi! Zarejestruj się w InstaForex i uzyskaj dostęp do jeszcze większej liczby bezpłatnych usług dla zyskownego handlu.

