 Anuluj
Warunki handlowe
Narzędzia


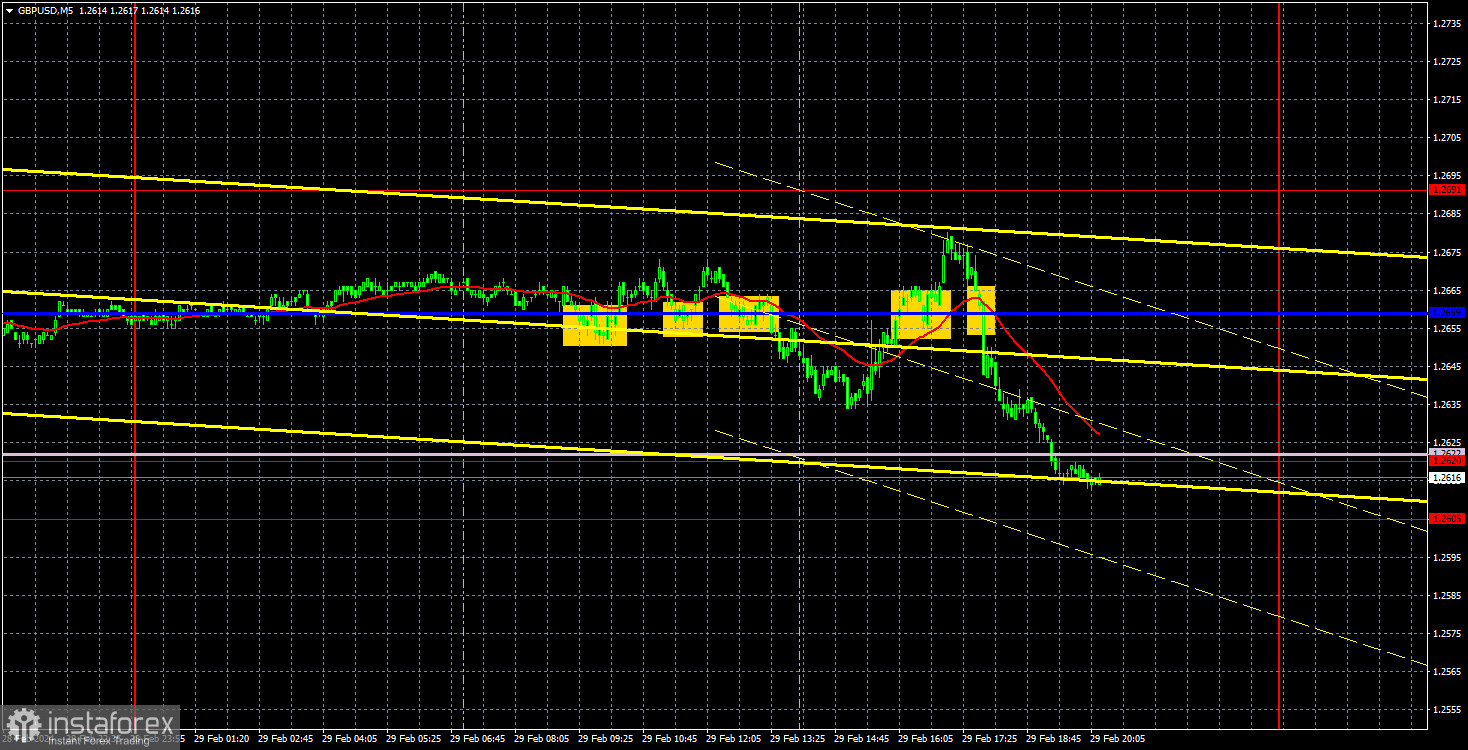
On Thursday, GBP/USD continued to trade in the sideways channel of 1.2620-1.2691. Yesterday, we had the impression that a new downward trend was starting to form, which we have been waiting for a long time. However, the price failed to overcome the notorious range of 1.2605-1.2620. A rebound took place, and the British pound moved up again. We have already talked about the flat and the sideways channel, and we will continue to mention this because there is nothing else to analyze. The British currency is still trapped in a narrow price range, with a sideways channel on every timeframe. So, we're seeing a flat within a flat within a flat, and so on...
Yesterday held no intrigue for the British pound. Secondary US reports are not enough to end a multi-level flat. Throughout the day, the pair's volatility was about 65 pips. The pair overcame the ascending trend line, but nothing changed. Even if the pair exits the 1.2620-1.2691 channel, it does not guarantee the end of the sideways movement.
We shouldn't expect good signals and strong movements since we have sideways movement on all levels and timeframes. The price formed signals near the critical line five times. In four out of five cases, the pair could not even reach the nearest target level, which required passing a "whopping" 25 pips. Therefore, we will remind you that in a flat phase, we often receive false signals, the Ichimoku indicator lines get weaker, and movements turn out to be random.
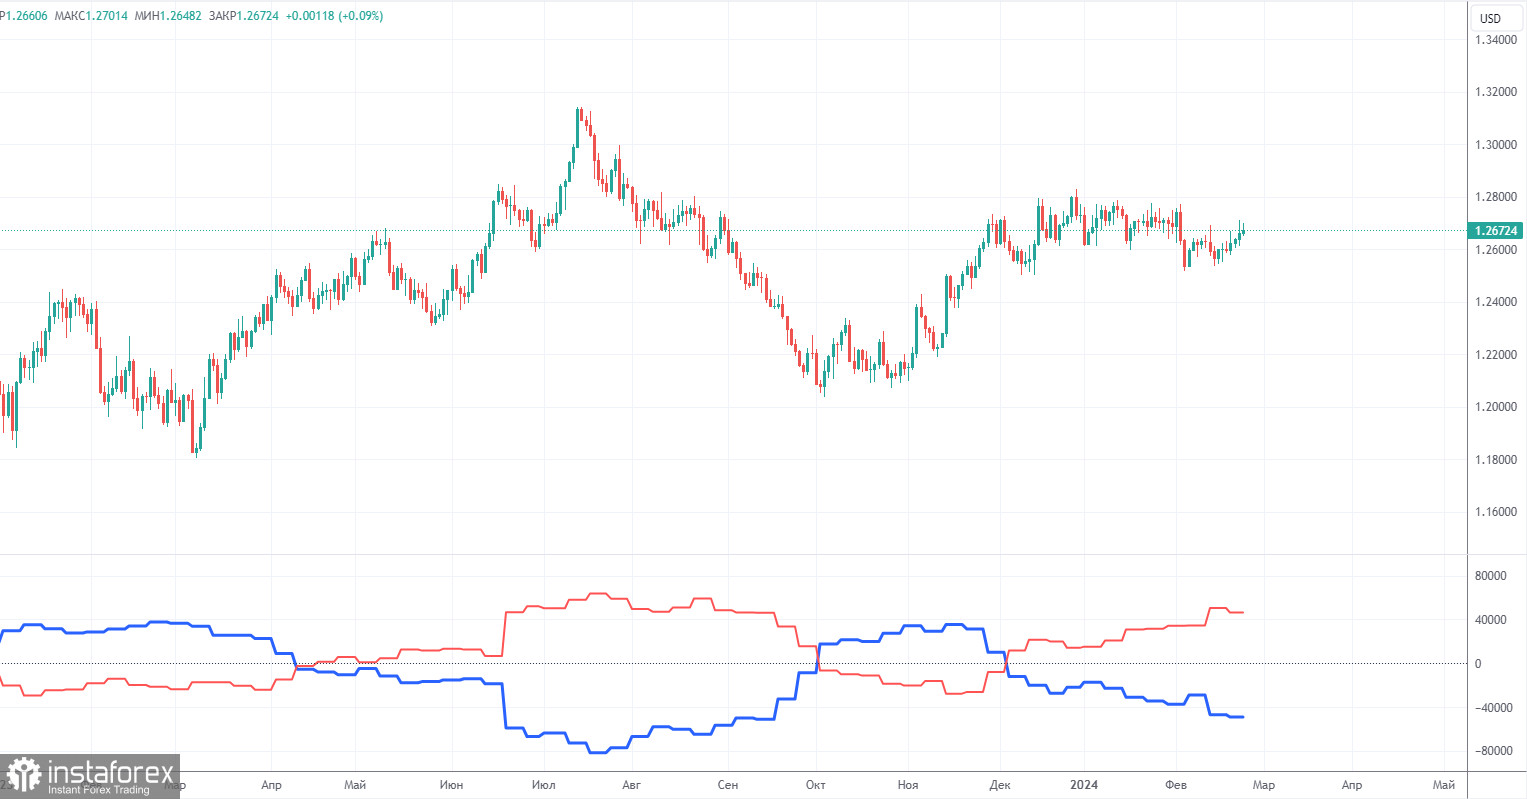
COT reports on the British pound show that the sentiment of commercial traders has frequently changed in recent months. The red and blue lines, which represent the net positions of commercial and non-commercial traders, constantly intersect and, in most cases, remain close to the zero mark. According to the latest report on the British pound, the non-commercial group closed 2,900 buy contracts and opened 1,200 short ones. As a result, the net position of non-commercial traders decreased by 4,100 contracts in a week. Despite the fact that the net position of speculators is growing, the fundamental background still does not provide a basis for long-term purchases of the pound sterling.
The non-commercial group currently has a total of 87,600 buy contracts and 42,300 sell contracts. The bulls' advantage is almost twofold. However, in recent months, we have repeatedly encountered similar situations: the net position either increases or decreases, the advantage passes from bulls to bears and vice versa. Since the COT reports do not provide an accurate forecast of the market's behavior at the moment, we have to scrutinize the technical picture and economic reports. The technical analysis suggests that there's a possibility that the pound could show a pronounced downward movement, and the economic reports have also been significantly stronger in the United States than in the United Kingdom, but this has not benefited the dollar.
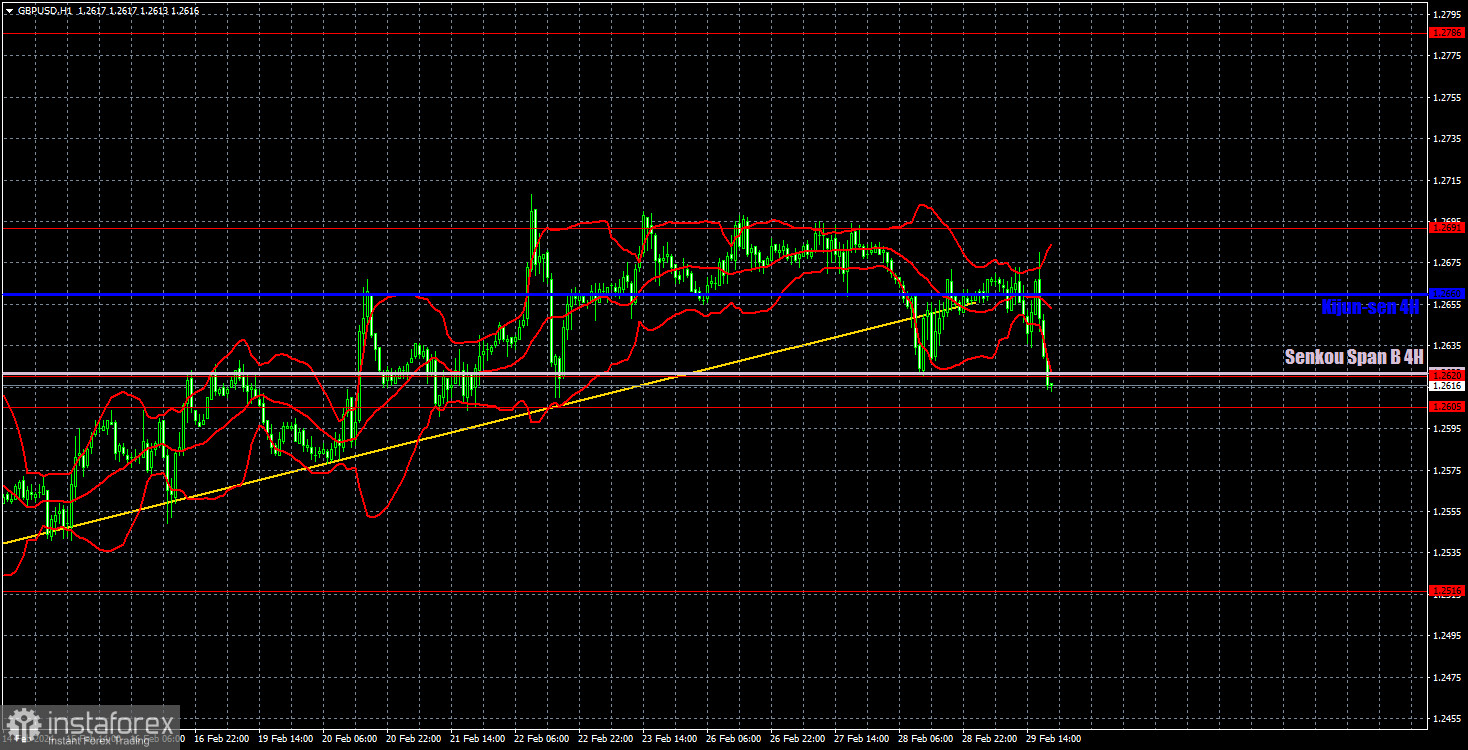
On the 1H chart, GBP/USD left the sideways channel of 1.2611-1.2787 and it still has the potential to form a downtrend. However, we've noticed that the market is not in a rush to sell the pound. The price has been moving sideways (which is clear on the higher timeframes), and market participants feel comfortable in a flat phase. The British pound is still a currency that tends to move sideways, trading in a somewhat illogical and confusing manner. On lower timeframes, we regularly observe short-term trends, but it has been quite difficult to make profit from them, as the price constantly changes its direction, and volatility is also low.
As of March 1, we highlight the following important levels: 1.2215, 1.2269, 1.2349, 1.2429-1.2445, 1.2516, 1.2605-1.2620, 1.2691, 1.2786, 1.2863, 1.2981-1.2987. The Senkou Span B (1.2622) and Kijun-sen (1.2660) lines can also serve as sources of signals. Don't forget to set a Stop Loss to breakeven if the price has moved in the intended direction by 20 pips. The Ichimoku indicator lines may move during the day, so this should be taken into account when determining trading signals.
On Friday, the only UK report for the week will be released – the second estimate of the Manufacturing Purchasing Managers' Index (PMI). The US will release a crucial report on February's ISM Manufacturing, as well as a secondary report on the University of Michigan Consumer Sentiment Index. Let's hope that the pair can show us some trending movement.
Support and resistance levels are thick red lines near which the trend may end. They do not provide trading signals;
The Kijun-sen and Senkou Span B lines are the lines of the Ichimoku indicator, plotted to the 1H timeframe from the 4H one. They provide trading signals;
Extreme levels are thin red lines from which the price bounced earlier. They provide trading signals;
Yellow lines are trend lines, trend channels, and any other technical patterns;
Indicator 1 on the COT charts is the net position size for each category of traders;
Indicator 2 on the COT charts is the net position size for the Non-commercial group.
Dzięki analizom InstaForex zawsze będziesz na bieżące z trendami rynkowymi! Zarejestruj się w InstaForex i uzyskaj dostęp do jeszcze większej liczby bezpłatnych usług dla zyskownego handlu.


