 Anuluj
Warunki handlowe
Narzędzia


EUR/USD resumed its upward movement on Wednesday, without going through any significant corrections. It is important to note that while the charts of the pair's movements may appear fairly strong and trend-oriented, the pair's volatility is actually quite low. In other words, the price moves approximately 40 pips per day. With such low volatility, it is extremely difficult to rely on good trading signals and profit from them.
Keep in mind that we can only justify the euro's rise due to the technical need for a bullish correction. Prior to the start of the current upward movement (about a month ago), the pair had been falling for a long time. Therefore, the current growth may be part of a correction that is long overdue. However, regardless of the fundamental and macroeconomic background, the euro continues to rise while the dollar falls. The US consumer price index due on Tuesday showed that inflation actually increased in February. This news prompted a 20-pip reaction in favor of the dollar. Yesterday, the euro easily rose by 40 pips, even though the only report of the day was on Eurozone industrial output, which failed miserably as it showed values that were twice as bad as forecasted. Therefore, there is no logic behind the pair's movements right now. The market simply opens long positions almost every day, that's all.
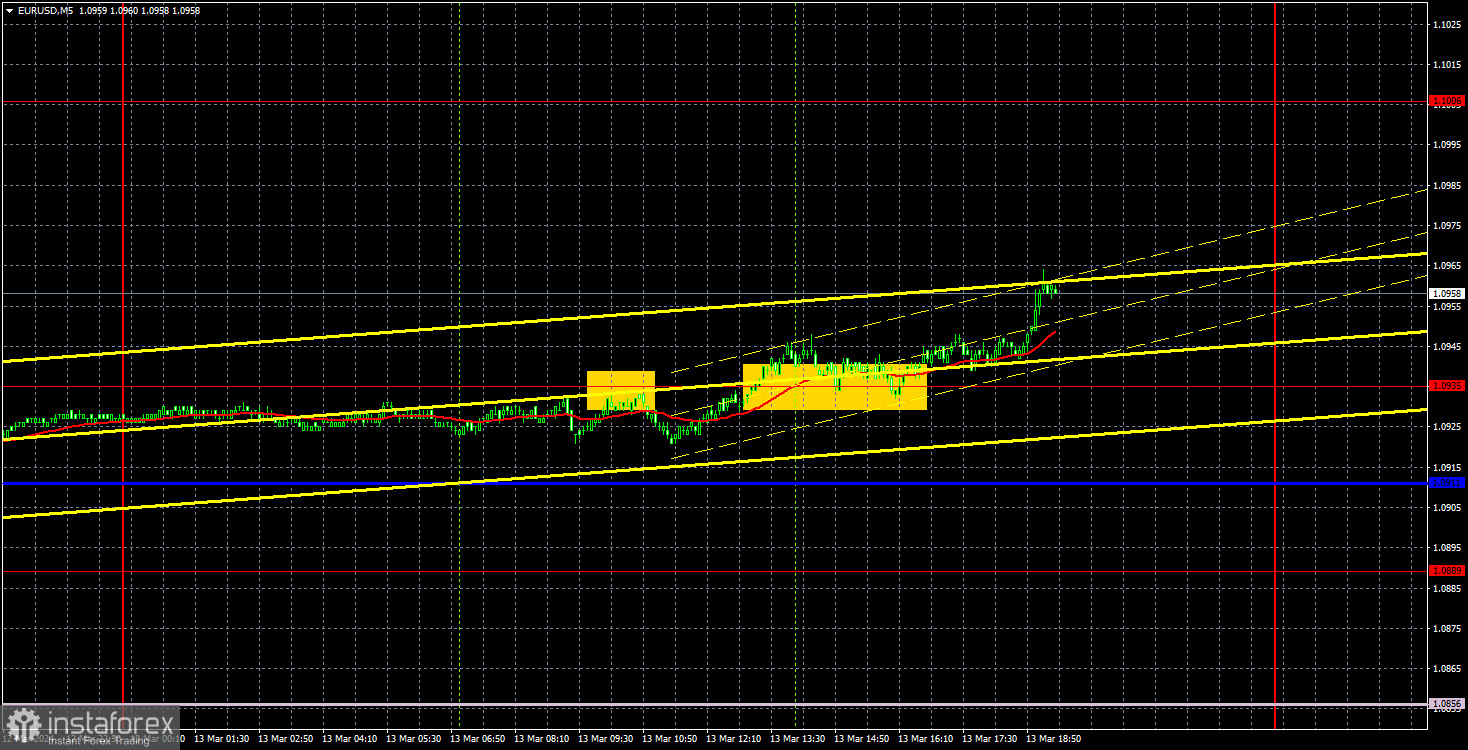
It makes no sense to discuss the trading signals when the current volatility is inexplicably low. The first sell signal turned out to be a false signal. And traders could gain 20 pips with the second buy signal. You may continue to hold on to long positions, setting a Stop Loss to breakeven. If the price moves in the same direction almost every day, this would be prudent. However, it is important to remember that there is no logic behind the euro's growth. Therefore, it's impossible to predict when this movement will end.
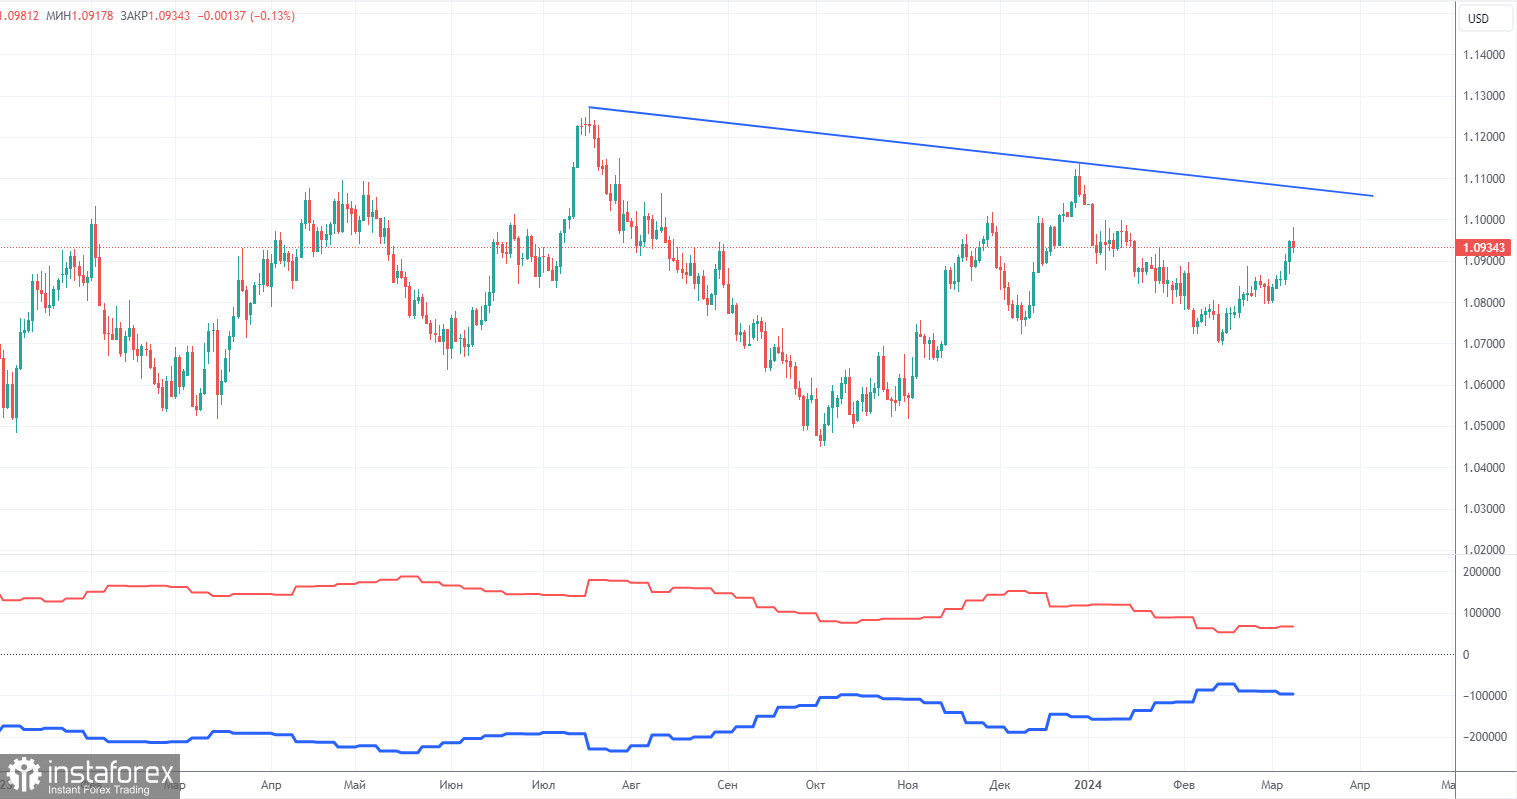
The latest COT report is dated March 5. The net position of non-commercial traders has been persistently bullish for quite some time. Basically, the number of long positions in the market is higher than the number of short positions. However, at the same time, the net position of non-commercial traders has been decreasing in recent months, while that of commercial traders has been increasing. This shows that market sentiment is turning bearish, as speculators are increasing the volume of short positions on the euro. We don't see any fundamental factors that can support the euro's growth in the long term, while technical analysis also points to the formation of a downtrend.
We have already drawn your attention to the fact that the red and blue lines have significantly diverged, often preceding the end of a trend. Currently, these lines are moving towards each other (indicating a trend reversal). Therefore, we believe that the euro will fall further. During the last reporting week, the number of long positions for the non-commercial group decreased by 5,200, while the number of short positions decreased by 8,600. Accordingly, the net position increased by 3,400, which is relatively small. The number of buy contracts is still higher than the number of sell contracts among non-commercial traders by 66,000 (previously 63,000). Thus, commercial traders continue to sell the euro.
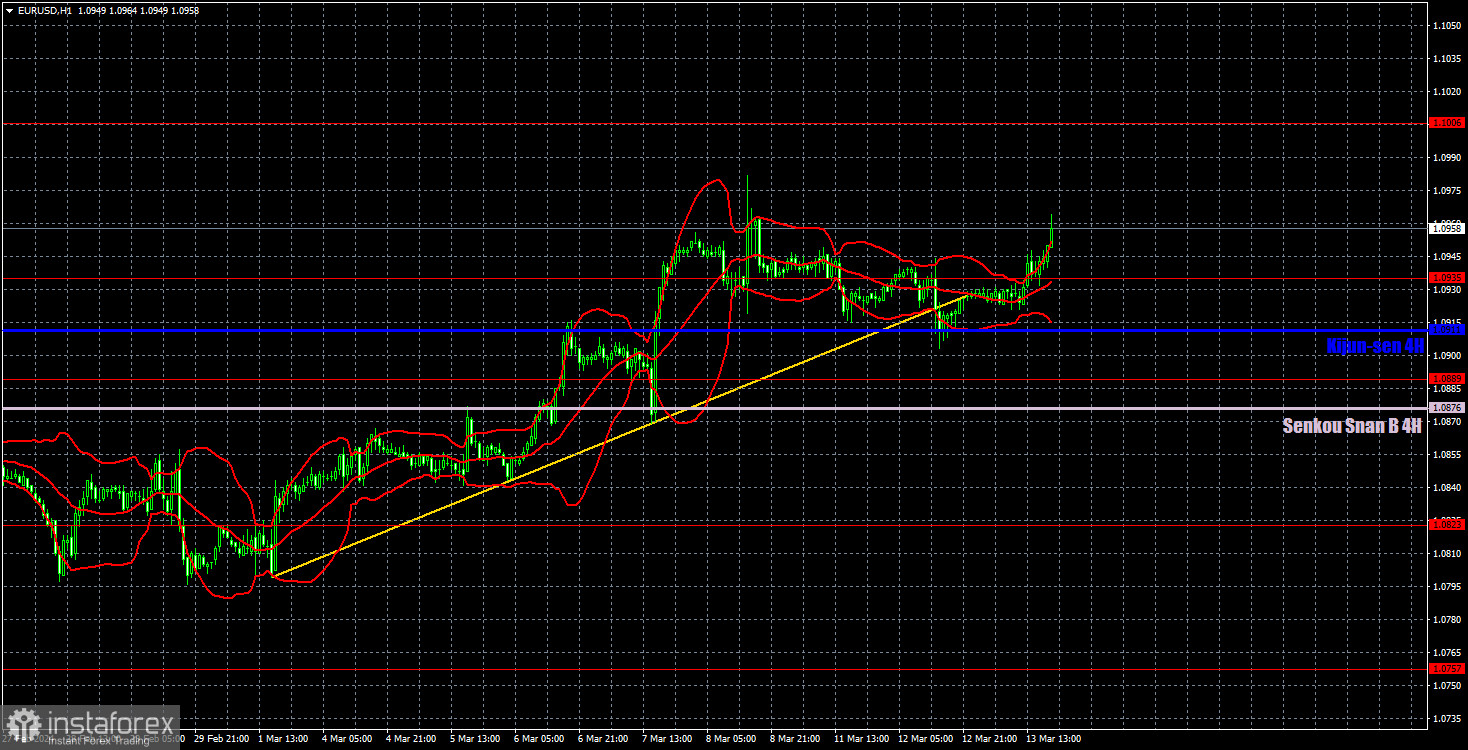
On the 1-hour chart, the uptrend remains intact even if the pair breached the trendline. In our opinion, all the factors currently suggest that the dollar will strengthen, but the market is still buying the euro for no apparent reason. Therefore, we expect the pair to resume its downward movement, but first it needs to overcome the Kijun-sen line. Therefore, the uptrend may persist for now.
On March 14, we highlight the following levels for trading: 1.0530, 1.0581, 1.0658-1.0669, 1.0757, 1.0823, 1.0889, 1.0935, 1.1006, 1.1092, as well as the Senkou Span B line (1.0876) and the Kijun-sen line (1.0911). The Ichimoku indicator lines can move during the day, so this should be taken into account when identifying trading signals. Don't forget to set a Stop Loss to breakeven if the price has moved in the intended direction by 15 pips. This will protect you against potential losses if the signal turns out to be false.
There are no significant events scheduled in the European Union. The US docket will feature reports on producer prices, retail sales, and initial jobless claims. These are not crucial reports, and the US dollar is currently declining regardless of the macroeconomic background.
Support and resistance levels are thick red lines near which the trend may end. They do not provide trading signals;
The Kijun-sen and Senkou Span B lines are the lines of the Ichimoku indicator, plotted to the 1H timeframe from the 4H one. They provide trading signals;
Extreme levels are thin red lines from which the price bounced earlier. They provide trading signals;
Yellow lines are trend lines, trend channels, and any other technical patterns;
Indicator 1 on the COT charts is the net position size for each category of traders;
Indicator 2 on the COT charts is the net position size for the Non-commercial group.
Dzięki analizom InstaForex zawsze będziesz na bieżące z trendami rynkowymi! Zarejestruj się w InstaForex i uzyskaj dostęp do jeszcze większej liczby bezpłatnych usług dla zyskownego handlu.

